

I. Introduction
II. System model for estimating bubble size distribution using attenuation loss
III. PINN for estimating bubble size distribution
3.1 NN architecture for linear system
3.2 Loss function in PINN
3.3 Deep ensemble for assessing the uncertainty of estimation
IV. Performance analysis of deep ensemble Ada-LISTA in estimating bubble size distribution
4.1 Data setup
4.2 Inversion of bubble size distribution using PINN of deep ensemble Ada-LISTA
V. Conclusion
I. Introduction
The population of bubbles in water is one of the key factors affecting the transmission of underwater sound. The acoustic characteristics of bubbles, such as resonance, scattering, and attenuation depend on the size and amount of the bubbles. In various fields, many work have been performed to measure the bubble size distribution (or bubble population).[1] As it is challenging to observe the bubble population directly, several studies have focused on predicting the bubble size distribution by utilizing their properties.[2]
Based on the Medwin’s approach, measurable attenuation loss according to frequencies and bubble size distribution can be expressed as a simple linear relationship[2] and its inversion yields the bubble size distribution from the attenuation loss. In general, however, it is an underdetermined problem as the dimension of the attenuation loss (the number of given conditions) is smaller than that of the bubble size distribution (the number of unknowns).[3]
One of approaches for solving the ill-posed problem is a convex optimization, which estimates the optimal solution that minimizes objective function subject to constraints.[4] However, the convex optimization solver such as CVX requires a huge computational burden and cannot assess the uncertainty of the solutions.[5]
To estimate the uncertainty, we employed the concept of homogeneous deep ensemble learning, which is the method of combining multiple models based on Neural Networks (NNs) with the same architecture, but different initial values. Also, it yielded better performance than any of the individual models.[6] For the deep ensemble, we chose Physics-Informed Neural Network (PINN) with Adaptive Learned Iterative Shrinkage Thresholding Algorithm (Ada-LISTA), which considers characteristics of the linear system during training to obtain an effective solution and enhance generalization.[7,8]
This paper is organized as follows. Sec. II explains the system model for relationship between the attenuation loss and bubble size distribution. Sec. III introduces PINN with Ada-LISTA for deep ensemble. In Sec. IV, simulations are carried out to examine performance of proposed scheme for estimating bubble size distribution using attenuation loss. Sec. V concludes the present study.
II. System model for estimating bubble size distribution using attenuation loss
As sound wave propagates through bubbly water, bubbles oscillate at resonant frequency, which is determined by bubble size. This oscillation causing absorption and scattering results in power loss of the incident wave. The total loss in power is denoted as attenuation loss, which is the ratio of incident wave intensity to attenuated wave intensity in decibel scale.[2] It can be expressed as follows:
where N is the number of the interval of bubble size distribution, is extinction cross sections related to the absorption and scattering of bubble, is the number of bubble between and per unit volume (also referred as to bubble density), and is a radius spacing between the interval.
From Eq. (1), the attenuation loss has a linear relationship with the bubble size distribution as follows:
where elements of , and are attenuation loss , 4.34, and bubble density , respectively.
To prevent a bias causing from uneven norms of columns in matrix during the solving the linear system of Eq. (2), we conduct a normalization to make the columns of matrix have ones as follows:
Elements of A and are 4.34 and , respectively. is the -column of matrix and is the corresponding norm.
In this problem, the inverse problem to obtain from has an underdetermined linear system because the number of the attenuation loss is generally smaller than that of the bubble size distribution.
III. PINN for estimating bubble size distribution
PINN is a NN used for numerical solutions of Partial Differential Equation (PDE). It employs prior information such as PDE (i.e., physical laws) as a regularization term to constrain the solution space and enhance generalization.[7]
We propose a modified version of PINN that utilizes the linear system of Eq. (3) as prior knowledge to obtain solutions effectively. First, we replace the conventional NN architecture of PINN with Ada-LISTA considering the linear system model to enhance the performance of estimating the bubble size distribution and generalization (Sec III. 3.1); when using the conventional NN architecture of PINN, estimated bubble size distributions are significantly deviated from true values during test (not seen here). Next, loss functions of Ada-LISTA involve the physics-informed loss function from the linear system to satisfy the relationship between the attenuation loss and bubble size distribution (Sec III. 3.2). At the end, we apply the deep ensemble to increase the performance of modified model, and to assess the uncertainty of solutions (Sec III. 3.3).
3.1 NN architecture for linear system
Ada-LISTA, which is derived from Iterative Soft Thresholding Algorithm (ISTA), has been introduced in image processing. ISTA has been used to infer an optimal solution for linear system in image denoising by iteratively updating the solution through a series of loops. However, ISTA has limitations, such as low convergence rates.[9]
To produce approximate estimations fast by training, Learned-ISTA (LISTA), which interprets ISTA from a NN perspective, was proposed.[9] LISTA is a data-driven algorithm that uses measurement data and matrix of system to train the model. However, it has lack of generalization performance. To address these limitations, Ada-LISTA was introduced.[8]
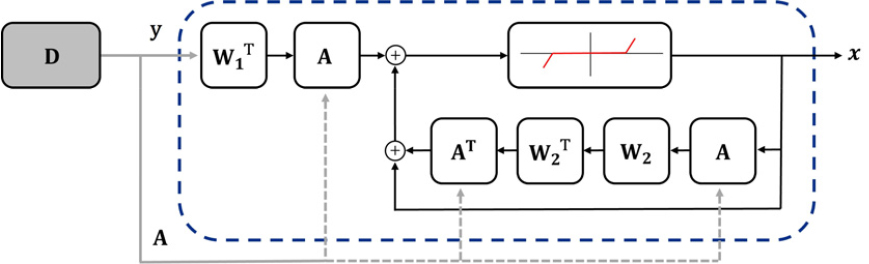
Ada-LISTA is a learned solver that adapts to the matrix of the system model during training. The output is iteratively reconstructed to be close to label by updating parameters along layers (Fig. 1). Using , A and (the output of the previous layer), Ada-LISTA produces with the following iteration:
where is the layer index from 1 to , is a soft thresholding function with threshold value , and is the parameter which supports Ada-LISTA to convergence in linear rate. and are weight matrices. is the step size. Learned parameters, which are collected in , are , and . Here, the output of layer becomes final prediction in this problem.
3.2 Loss function in PINN
The loss function in PINN for estimating the bubble size distribution is defined as follows:[7]
where is the number of training data, is the output of Ada-LISTA, and is label. Each term in the loss function means as follows: 1) trains the Ada-LISTA in supervised learning frame which minimizes the error between from and the corresponding label . 𝛾 is a hyperparameter that controls the impact of the supervised learning loss function in the training. 2)trains the Ada-LISTA to follow the physics in the form of linear system, which is different from the conventional PINN using a PDE for loss function.
3.3 Deep ensemble for assessing the uncertainty of estimation
The deep ensemble is a method of combining the predictions from several machine learning models to increase a prediction accuracy, which is better than any of the individual models. Especially, homogenous deep ensemble is a technique that averages predictions from NNs having the same architecture but having different initialization. Since different initial values in NNs lead to different local minima, these diverse solutions can yield a better solution with their average and offer uncertainty of the solutions with their variance.[6]
We train many Ada-LISTAs with different initial values using Eq. (5) and obtain the final solution and uncertainty with the average and variance, respectively.
IV. Performance analysis of deep ensemble Ada-LISTA in estimating bubble size distribution
4.1 Data setup
Owing to difficulty in conducting experiments and labeling data for inverting the bubble size distribution using attenuation loss, we generated training and test dataset using the system model in Sec. II.
The training dataset consists of 5 000 input-output pairs. Elements of input and output are attenuation loss at a specific frequency and normalized bubble density at a specific bubble radius. For the normalization, is randomly generated between zero and one and is scaled to be a low void fraction regime, where the linear system is valid, as follows:
where V is void fraction, which is less than 10-4.
Input data y consists of at 781 frequencies spaced 10 Hz apart, ranging from 200 Hz to 8k Hz and has weak noise; signal-to-noise ratio is about 10 dB. The frequency range is determined by considering data from the relevant experiment conducted by Hanwha Ocean Co (not seen here). Output data consists of at 1 500 bubble radii from 580 μm to 15 000 μm. The smallest radii of 580 μm corresponds to a resonant frequency 8 kHz. However, the largest bubble size is set as 15 000 μm because of the difficulty to observe bubble radii above the limit in the relevant experiments.[5]
In the training phase, the data pair is made with randomly generated bubble size distribution and the corresponding attenuation loss . Since the attenuation loss becomes different according to activating region in the bubble size distribution, the training dataset involves a data pair of (), where components in a specific region of have non-zero values, as shown in Fig. 2 (the first 2 500 instances for ); the remaining data pairs are obtained by activating all components of . By using the training dataset as above, deep ensemble Ada-LISTA experiences dynamic patterns during training and it is advantage to better generalization.
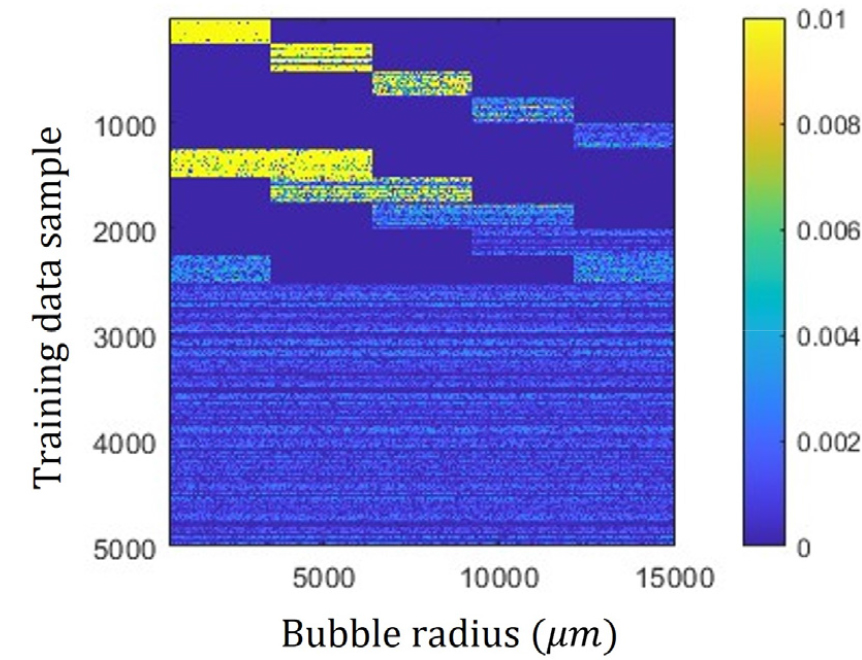
Fig. 2.
(Color available online) Data samples for x in training dataset. For the visualization, original (or unnormalized) bubble size distribution is displayed in the range of 0 to 0.01. To generate dynamic attenuation loss patterns during training, components of specific region in x have non-zero values (the first 2 500 samples for x).
During test, the bubble size distribution is estimated using the trained deep ensemble Ada-LISTA for a given . Unlike in the training phase, normal distributions with various standard deviations are used for to generate deviated from that in the training dataset.[10] With this setting, the generalization can be evaluated by analyzing bubble estimation performance in the test phase. The datasets are summarized in Table 1.
Table 1.
Summary of dataset.
| Dataset | Training / Validation | Test | |
| Number of dataset | 5 000 / 1 000 | 500 | |
|
Input | Number of frequencies (Range) |
781 (200 Hz to 8 000 Hz) | |
| Distribution |
Activation distribution in specific region (Fig. 2.) | Gaussian distribution | |
|
Output | Number of bubble radii (Range) |
1 500 (580 μm to 15 000 μm) | |
4.2 Inversion of bubble size distribution using PINN of deep ensemble Ada-LISTA
Layer number, epoch number, and learning rate are 6 ( = 6), 1 500 and 10-4, respectively, which are determined empirically. The hyperparameter 𝛾 of the loss function is set as 0.05, which yields similar results in the range of 0.01 to 0.1. We train 20 Ada-LISTAs with different initial values and apply 500 attenuation losses from the test dataset, which are different from those in the training dataset.
On the other hand, the convex optimization solver of CVX is applied to the same attenuation losses for a comparison. The objective function in the convex optimization is as follows:
The first norm find a solution to satisfy the linear system and the second norm prevents the solution from CVX to have too-large components. , which controls the balance between two norms, is empirically determined as one. The constraint makes all components of solution have non-negative values as in the actual bubble population.
As shown in Fig. 3(b) and (c), estimated results from deep ensemble Ada-LISTA are in better agreement with true values than CVX. For a quantitative analysis, mean square errors calculated using 500 test samples for deep ensemble Ada-LISTA and CVX, which correspond to 6.2 × 10⁻⁴, 2.4 × 10⁻³, respectively.
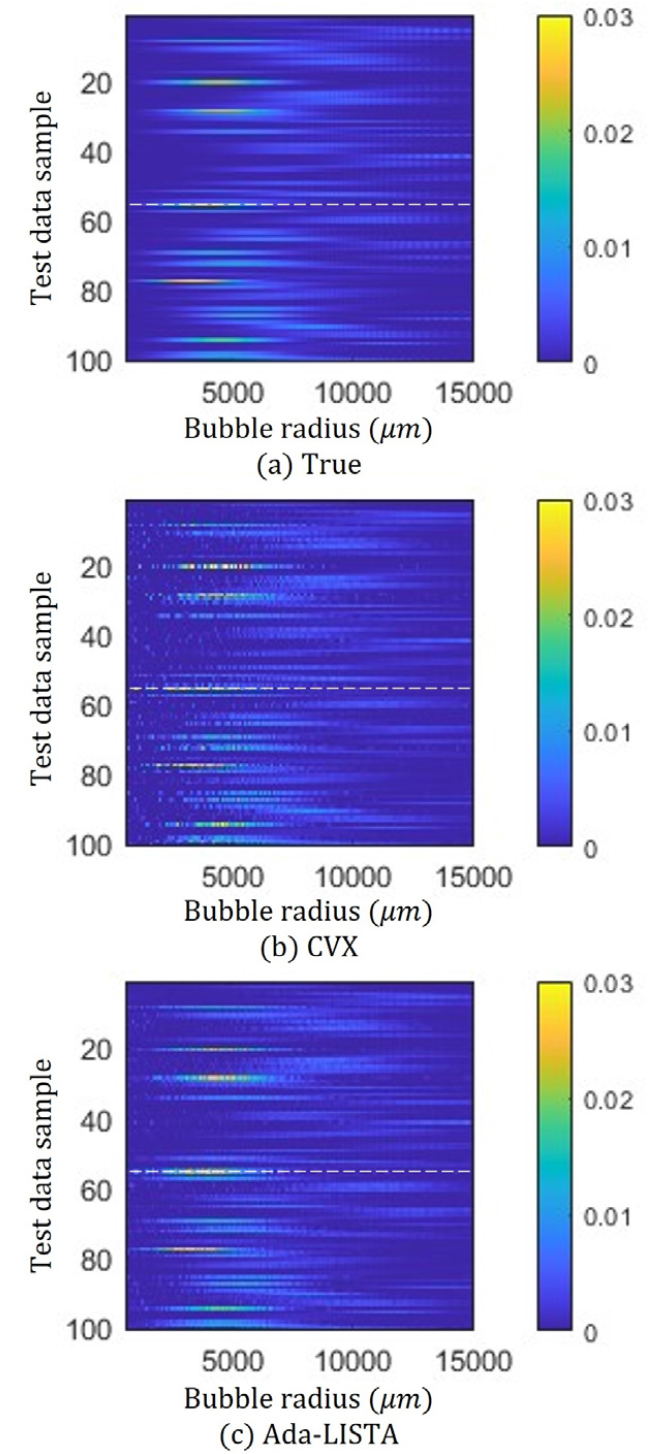
Fig. 3.
(Color available online) Bubble size distributions estimated using CVX and deep ensemble Ada-LISTA: true values (a) and estimated values from CVX (b) and deep ensemble Ada-LISTA (c). 100 out of 500 results are displayed for a clear performance comparison. The bubble size distribution marked with dashed line (the 55th test sample) will be used for a detailed performance investigation.
For a detailed performance investigation, the specific bubble size distribution of the 55th test sample is used and the inversion results using CVX and deep ensemble Ada-LISTA are shown in Fig. 4(a) and (b), respectively; for a clearer comparison, two results are displayed separately. The CVX result is in good agreement in terms of overall pattern. However, significant fluctuations are observed at the small bubble size region, which make the CVX result deviated from the true values. While the deep ensemble Ada-LISTA estimation also has a gap from the true values at the small bubble size region as in the CVX result, the fluctuations from CVX are considerably reduced. Furthermore, by using the variance of 20 Ada-LISTA estimations for deep ensemble, the estimation uncertainty can be evaluated [error bars in Fig. 4(b)]. The error bars are smaller in the large bubble size region, where the deep ensemble Ada-LISTA result is in good agreement with the true values. The opposite happens in the small bubble size region. From the estimated bubble size distributions, attenuation losses can be reconstrcted as shown in Fig. 4(c). The attenuation losses are very close to true value owing to physics-based constraint () in the objective or loss function.
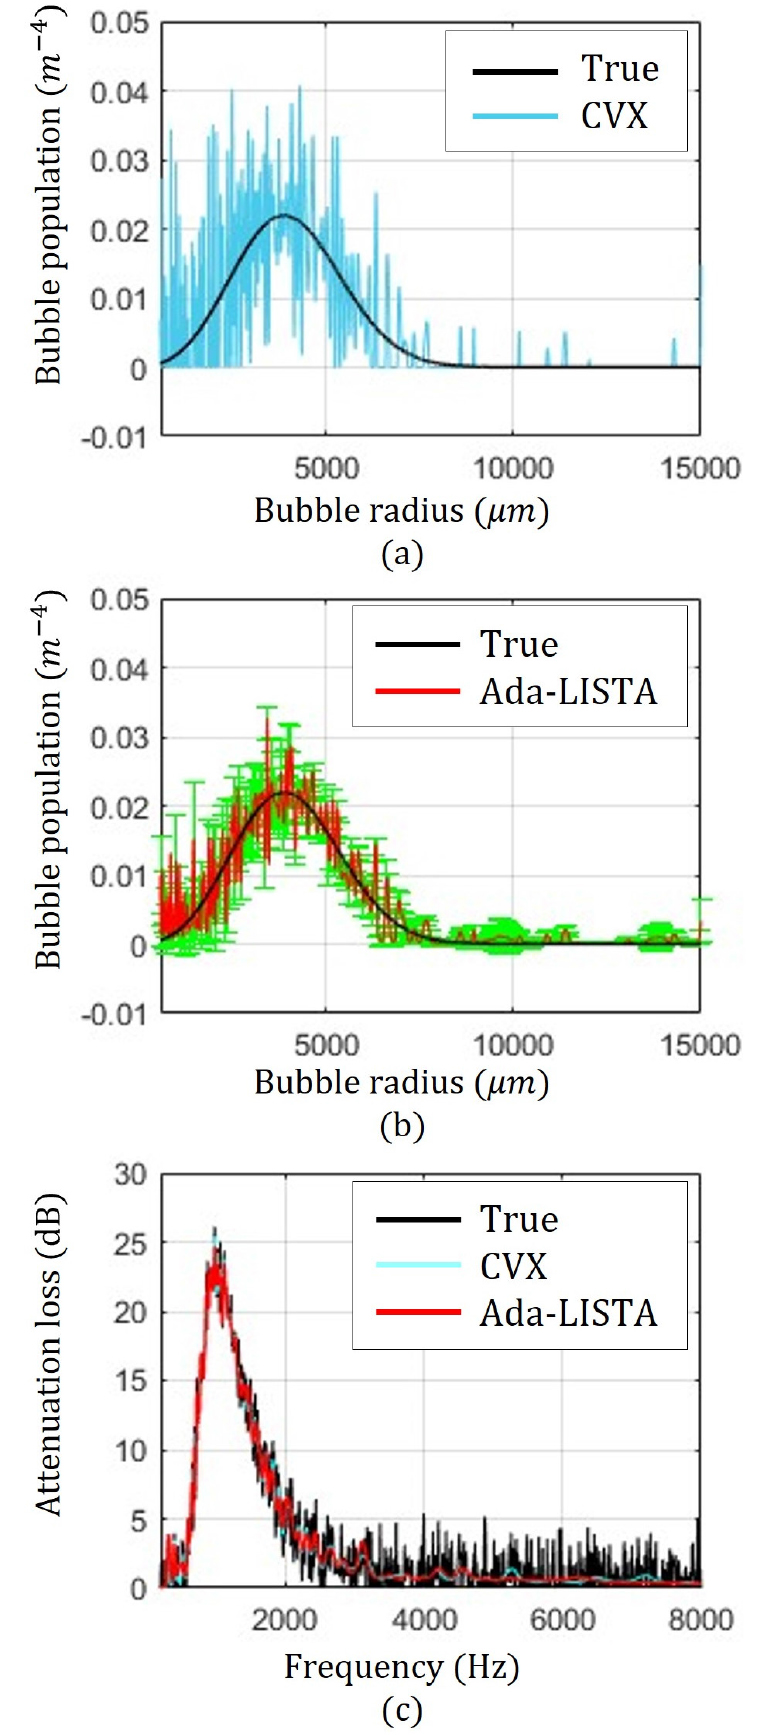
Fig. 4.
(Color available online) Bubble size distributions estimated using CVX (a), deep ensemble Ada-LISTA (b) for a specific attenuation loss, and reconstructed attenuation loss using the estimated bubble size distributions (c). The CVX results are deviated from true values by significant fluctuations at small bubble size region, which are reduced by deep ensemble Ada-LISTA displaying an estimation uncertainty with variance. The variances are displayed in every four bubble radius indices for clear representation.
V. Conclusion
In this paper, we propose the estimation of the bubble size distribution using deep ensemble of PINN with Ada-LISTA, which can consider the system’s characteristics.
This approach improves the bubble inversion performance and quantifies the uncertainty of the bubble inversion result.
In future work, we will estimate bubble size distributions using attenuation losses from water tank experiments to further investigate feasibility and utility of the proposed model.
