

I. Introduction
II. ACUA-EX20
2.1 At-sea experiment design
2.2 Design of transmitted signal packet
III. At-sea environmental analysis
3.1 Signal to Noise Ratio
3.2 Ambiguity function-based Doppler estimation
3.3 Channel impulse response
IV. Communication performance analysis based on time reversal processing
4.1 Signal reconstruction using probe signal
4.2 Results of communication performance analysis
V. Conclusions
I. Introduction
In deep water long-range communication, the effect of inter-symbol interference due to multipath is greater than in short-range communication, and the increase in transmission loss results in the use of lower carrier frequencies for effective signal transmission. High carrier frequencies allow the use of wide bandwidths, which enable higher data rates,[1] whereas a low carrier frequency in a long-range environment has the constraint of a narrow bandwidth. A smaller bandwidth translates to reduced data rates. Kilfoyle outlined the specifications of underwater telemetry modems and presented the ‘range-rate product’, which is a metric for data rate reduction with an increasing range within 10 km.[2] Shimura added experimental results to improve and supplement the metric.[3]
As shown in References [1] and [2], while the data rate within 10 km is several tens of thousands of Bits Per Second (BPS), in the case of long-range deep-water communication, previous studies reported data rates of less than 1,000 bps .[4,5,6,7,8,9,10,11,12,13,14,15,16,17,18. 19,20,21,22,23] Techniques such as higher-order modulation and multiple-input-multiple-output have been used to overcome the problem of low data rates overseas[4,5,6,11,13,14,15,16,18,19]; however, in Korea, only studies using Binary Phase-Shift Keying (BPSK), i.e., the lowest-order modulation scheme, have been reported.[20,21,22,23]
In this study, we investigated higher-order modulation schemes for long-range communication with the aim of improving the data rate. Data from Application-Adaptive Covert Underwater Acomm. EXperiment 2020 (ACUA- EX20) was obtained in the East Sea in October 2020. During the at-sea experiment, two types of PSK modulation signals and two types of Quadrature Amplitude Modulation (QAM) signals, which are higher-order modulations, were designed. A Vertical Line Array (VLA) was used for data acquisition, and the data were analyzed using time reversal communication, a method widely used in long-range environments for deriving an optimal solution by exploiting the reciprocity of the channel and combining it with a single channel equalizer.[7,8,9,10,12,16,17,19,21,22,23,24,25,26]
The remainder of this paper is organized as follows. Section II introduces ACUA-EX20, an at-sea experiment referred to in this paper, and the transmitted signals designed using higher-order modulation. In Sec. III, for at-sea environmental analysis, the Signal to Noise Ratio (SNR) is calculated, and the Doppler effect and channel impulse response are estimated. Section IV presents the performance of the analysis of communication along with examples of signal reconstruction using time reversal processing; the results are also compared in terms of data rates with values reported in overseas research. Finally, Sec. V concludes the paper.
II. ACUA-EX20
2.1 At-sea experiment design
In October 2020, ACUA-EX20, a long-range underwater acoustic communication experiment hosted by the Agency for Defense Development (ADD) with participation from several universities, was conducted in the east of Pohang. The purpose of our study was to analyze the performance of communication based on higher-order modulation to improve the data rate in long-range environments. Fig. 1 shows the experiment site where the experiment was conducted, and the yellow and red circles indicate the locations of the source and VLA, respectively. The source was connected to the Research Vessel (R/V) Cheonghae owned by the ADD and towed at the speed of 3 kn in the east direction.
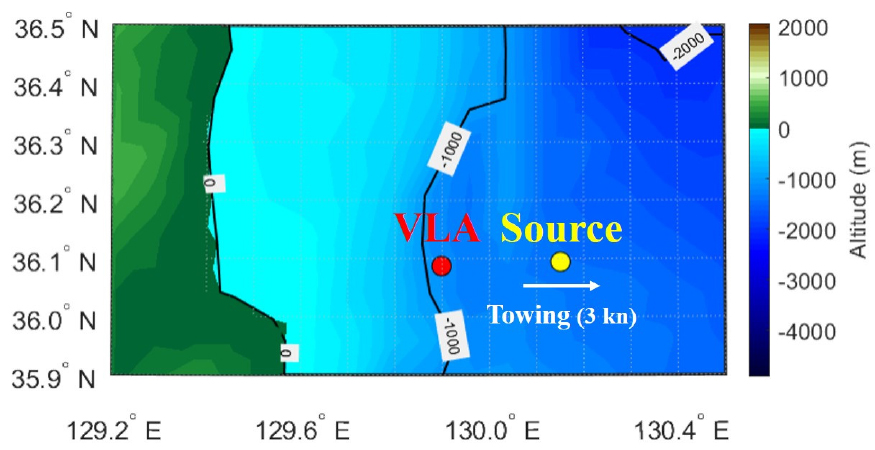
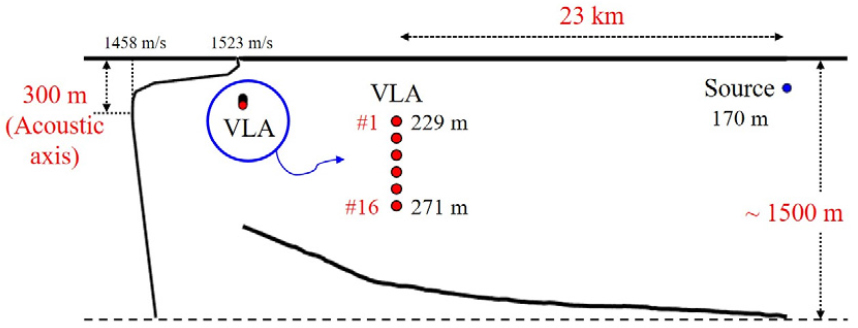
Fig. 2 presents a schematic of the at-sea experiment, and expressing the sound speed profile, depth of the source and VLA, and seafloor topography. In the long-range experiment, the transmission loss was significantly increased, and the extent of the transmission loss varied with respect to the acoustic axis depth, source depth, and range. An increase in the transmission loss indicates a decrease in the SNR, which is represented as a widened area of the estimated symbols in terms of constellation in communication. More specifically, high-order modulation, in which the inter-symbol distance on the constellation (Euclidean distance) is reduced, has limitations in long-range experiments. Therefore, to minimize the transmission loss, the signals are transmitted using a Deep Sound Channel (DSC). To utilize the DSC, first, the acoustic axis depth should be evaluated by measuring the sound speed profile. As shown in Fig. 2, the acoustic axis formed around the depth at 300 m in the sound speed profile measured at the source position. Specifically, it is more effective to maintain the depth of the source as close to 300 m as possible. However, the depth of the source was limited owing to factors such as the maximum cable length, rise of the source during towing, and weather conditions. Therefore, in this experiment, the depth was maintained at 170 m during towing.
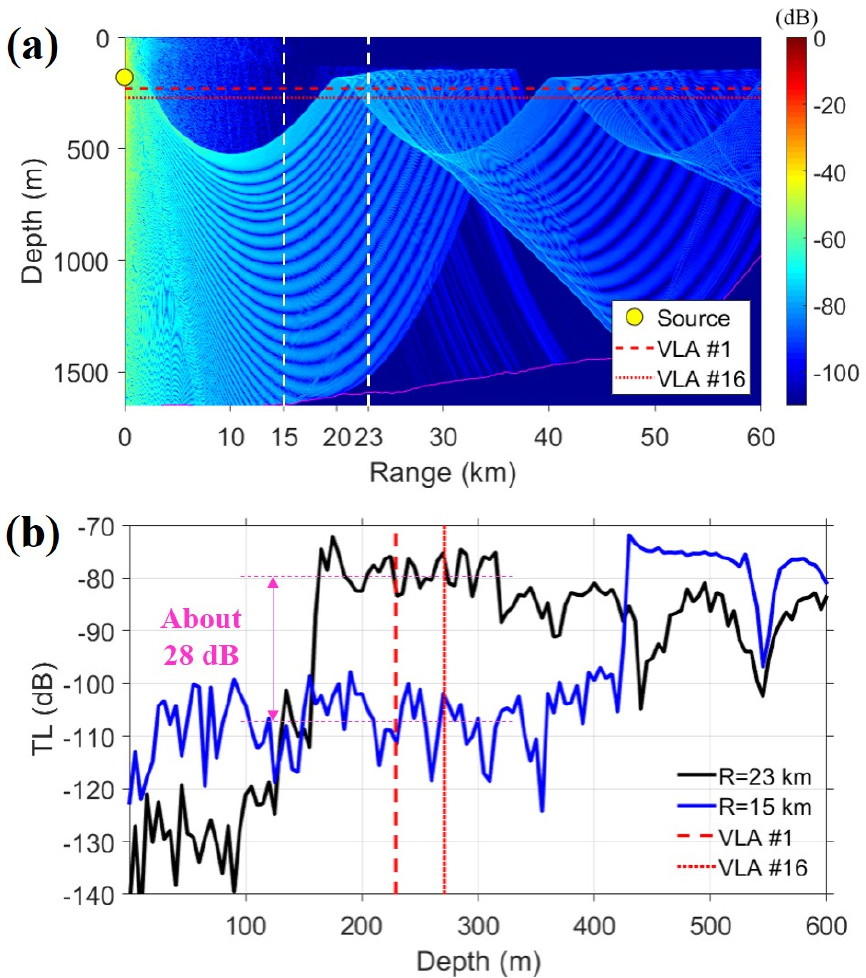
In the deep water of the East Sea, the sound speed profile shows a more rapid change toward the sea surface direction than to the seafloor direction relative to the acoustic axis, and the shadow zone becomes wider owing to the source located 130 m above the depth of the acoustic axis. Accordingly, the convergence zone was checked to set the range for signal transmission. Fig. 3(a) shows the results of transmission loss in the ACUA-EX20 environment calculated using the underwater sound propagation model. In the area with the depth of 229 m – 271 m where the VLA is installed, a zone with considerably low transmission loss (approximately 3 km – 18 km) close to the shadow zone was confirmed, and it can be observed that from 18 km or above, the area corresponds to the convergence zone apart from some sections. In this way, we transmitted communication signals in the vicinity of 23 km, which is a part of the convergence zone. To evaluate in detail the difference in transmission loss between the convergence zone and the other regions, Fig. 3(b) shows the results of transmission loss per depth at two ranges: 15 km, which is one of the sections with low transmission loss, and 23 km, which is the range at which the signal is transmitted, as indicated by the white dashed lines in Fig. 3(a). It can be observed that the transmission loss in the range of 23 km from the depth where the VLA is located is, on average, approximately 28 dB lower than the transmission loss at 15 km. The result indicates that in a long-range environment with a large transmission loss, signal transmission using the convergence zone is relatively effective in DSC.
2.2 Design of transmitted signal packet
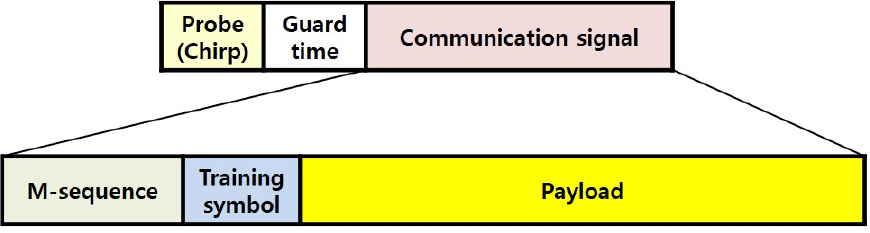
Fig. 4 shows the configuration of the transmitted signal packets to be analyzed in this study. The transmitted signal comprises a probe signal with the duration of 0.5 s for estimation of channel impulse response, guard time with the duration of 0.5 s, and a communication signal with the duration of 2.95 s. In the waveguide, when towing a source, the longer the duration of the signal, the more likely the Doppler shift occurs with time in the signal. Therefore, a communication signal is designed to minimize the duration. After designing the probe signals as chirp signals, a Hanning window was applied, and the carrier frequency and bandwidth were 2,560 and 1,024 Hz, respectively. The communication signals were designed using a Root-Raised Cosine (RRC) filter with the roll-off factor of 0.5 with a data rate of approximately 683 sps, comprising an M-sequence signal, 200 training symbols, and 1,300 payloads. The M-sequence signal is designed for Doppler estimation and synchronization and consists of 511 symbols to improve the estimation accuracy of synchronization of the received signals in a long-range environment where transmission loss is significantly increased. In addition, the configuration of the M-sequence signal of the duration is effective for Doppler estimation in a towing situation. Two hundred training symbols were designed for the equalizer application after time reversal processing. The RRC filter is used as a matched filter in the modulation/demodulation process. The frequency band of the communication signals is similar to that of the probe signals.
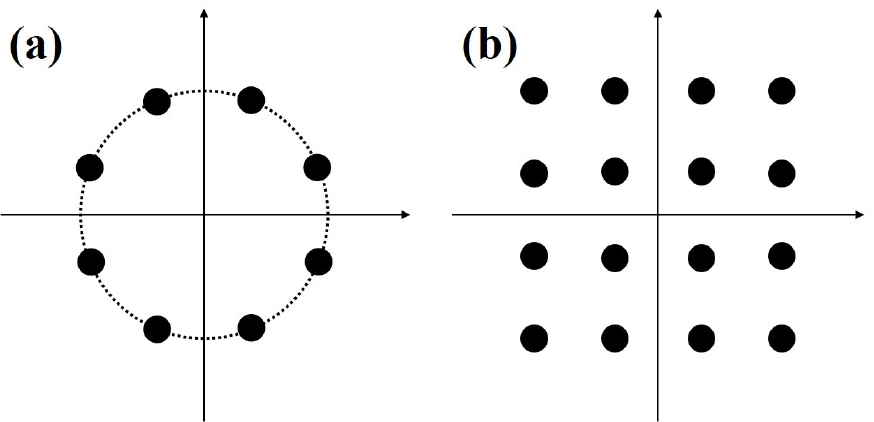
As described above, compared with short-range propagation, in long-range propagation, the available frequency bandwidth owing to transmission loss is reduced. Specifically, as the transmission range increases, the design data rate decreases. To increase the data rate in such environments with limitations, the use of a high-order modulation scheme may be an effective strategy. We designed the training symbols and payloads as Quadrature Phase Shift Keying (QPSK), 8PSK, 8QAM, and 16QAM, the higher-order modulation, and each signal was transmitted four times. PSK is a phase modulation technique, and QAM utilizes both phase and amplitude modulation. Because QAM uses amplitude modulation, it is sensitive to noise. Among them, the 16QAM signal is the most challenging owing to its short Euclidean distance. The spectral efficiency of the signals designed in this study ranges from a minimum of 1.33 bits/s ‧Hz (QPSK) to the maximum of 2.67 bits/s ‧Hz (16QAM). In Figs. 5(a) and 4(b), the constellations for the highest order modulation schemes (8PSK and 16QAM) among the PSK and QAM designed during the experiment are presented as an example for each type of signal.
III. At-sea environmental analysis
3.1 Signal to Noise Ratio
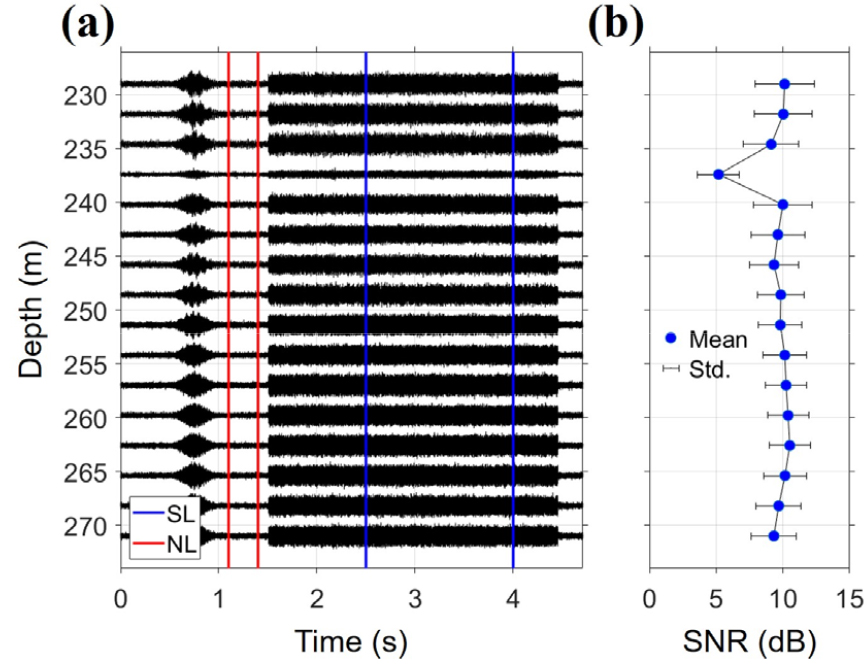
The higher the SNR, the greater the probability of demodulation of the communication signals; thus SNR was first examined from the measured data. Fig. 6(a) shows the signals received during the experiment. As a visual example, one QPSK-modulated signal is illustrated out of multiple data packets. In Fig. 6(a), the blue and red lines are zones for calculating the signal and noise levels, respectively, and the SNR for each channel calculated from the two zones is shown in Fig. 6(b). The SNR for each channel is represented as error bars using the mean and variance values for all transmitted data packets (16 in total). In the fourth channel from the top (hereafter, channel 4), amplification was not performed properly inside the receiver, therefore, the SNR was lower than in other channels. Excluding channel 4, the SNR was 10 dB on average, and the strong intensity of incoming signals was numerically confirmed. Specifically, from the values, the successful demodulation of the signals can be predicted in advance.
3.2 Ambiguity function-based Doppler estimation
As described above, the source was towed during the experiment, and thus the received signals reflecting the Doppler effect were measured. Owing to the Doppler effect, the phase of the symbols is shown in a rotating form on the constellation; therefore, the Doppler effect have to be compensated before performing the communication performance analysis based on time reversal processing. Eq. (1) calculates the ambiguity function for Doppler estimation and shows matched filtering of the transmitted signal to the received signal,[27]
Here denotes the transmitted signal, and denotes the signal including the time delay of the transmitted signal, i.e., the received signal; represents the Doppler frequency shift with respect to the carrier frequency.
Fig. 7 shows the result of the ambiguity function calculated by applying the M-sequence signal instead of the transmitted signal in Eq. (1). The ambiguity functions ars presented in Fig. 7(a) and 7(b) with respect to the Doppler frequency shift and the speed of the source connected to the R/V Cheonghae. The relationship between the Doppler frequency and speed of the source can be expressed as Eq. (2), and Fig. 7(b) is the representation of Fig. 7(a) in terms of the source speed using Eq. (2),
The second term of Eq. (2) represents the Doppler frequency regarding source movement, and when the source approaches from the receiver, the sign of the source speed, is positive. Here, indicates the speed of sound, and in general, because the source speed is small compared to the sound speed, it can be approximated to the third term by a geometric series. In the approximation equation, the part except the carrier frequency can be expressed as a Doppler frequency shift, and the ambiguity function can be expressed from two aspects through the relationship between the Doppler frequency shift and the source speed.
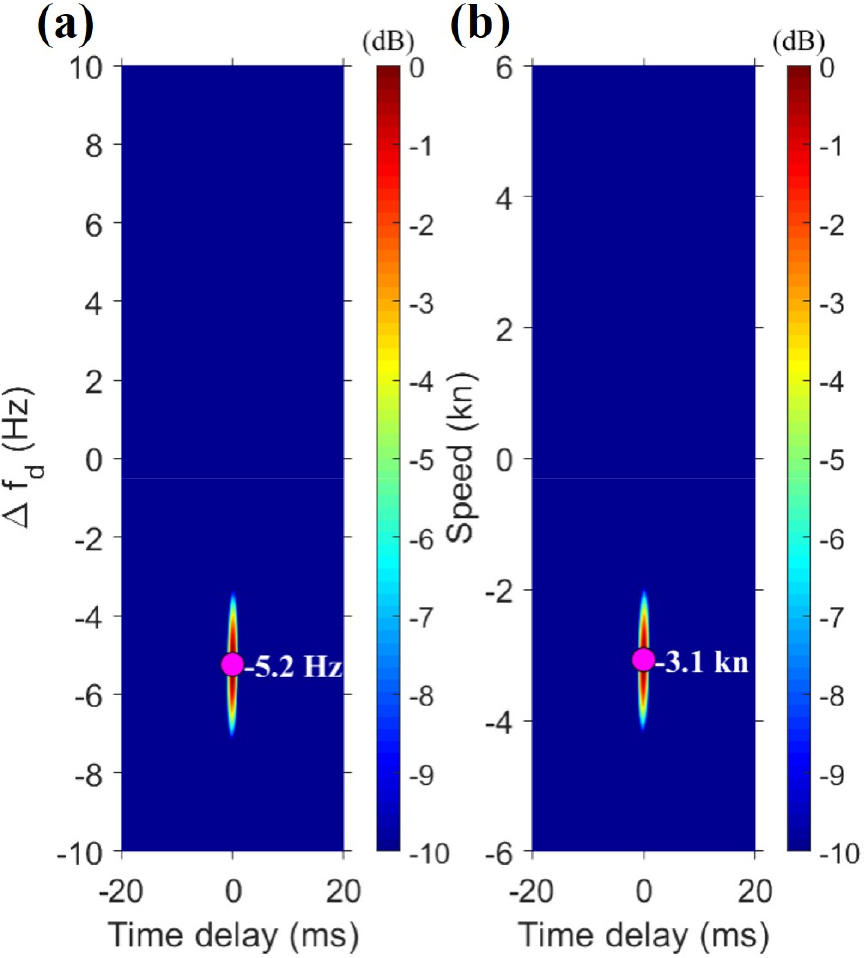
The towing speed can be derived from the maximum value of the ambiguity function in terms of the source speed. As the source moved away from the receiver during the experiment, the line of sight was constant, and it can be predicted that the source speed and the estimated Doppler speed are similar. The maximum value in Fig. 7(b) can be observed at -3.1 kn. Because this value is almost the same as the towing speed 3kn in magnitude, and the source is towed away from the receiver in the negative direction, it can be observed that the Doppler estimation using the ambiguity function yields a reasonable result.
3.3 Channel impulse response
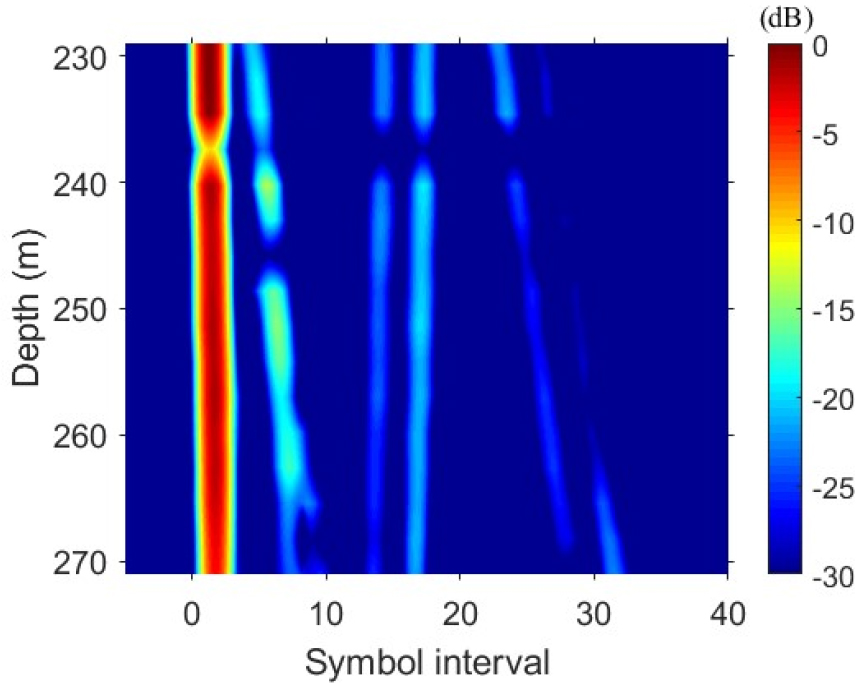
In this section, the channel impulse response is estimated using the probe signals. The channel impulse response can be estimated by applying the signals shown on the left side of Fig. 6(a) and the received probe signals to the matched filter, while Fig. 8 shows the channel impulse response result as a function of the depth. Information on delay spread can be obtained from the channel impulse response, and the generation of multipaths with a maximum length of 30 symbol lengths can be confirmed in the ACUA- EX20 environment. Converting this to time, this symbol length corresponds to approximately 0.05 s. The channel impulse response can also be regarded as the distribution of the arrival time of the eigenray between the source and receiver, as shown in Fig. 8, where the eigenray between the source and receiver varies according to the change in the receiver depth. This is effective with respect to the time reversal processing that exploits the diversity of channels, and this will be discussed in detail in the next section.
IV. Communication performance analysis based on time reversal processing
4.1 Signal reconstruction using probe signal
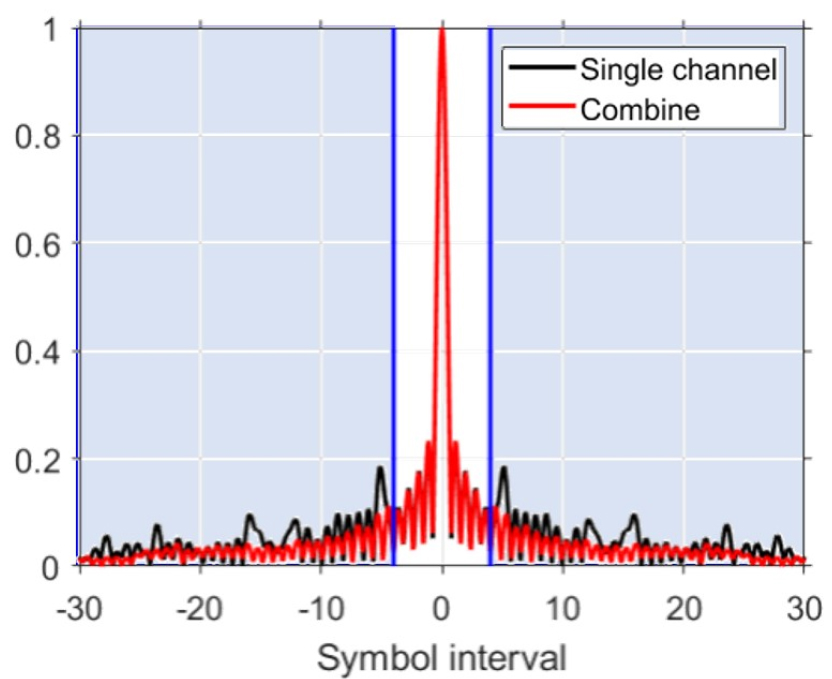
Song proposed the q-function, , as a metric to analyze the performance of time reversal processing.[28] is defined as the sum of auto-correlation of all channels and can be expressed as Eq. (3),
Here denotes the channel impulse response of the th channel and denotes the number of channels.
The closer the result of to the delta function, the better the performance of time reversal processing, indicating that the transmitted signals are well reconstructed. Fig. 9 shows the result of comparing auto-correlation of a single channel (channel 1 located at 229 m) (black line) and (red line). When a single channel is used, it can be observed that sidelobes are generated after a certain zone (blue box area in Fig. 9). However, when all channels are used, the sidelobes are reduced and the function is closer to the delta function, unlike in the case of using a single channel.
Time reversal processing is a technique that allows signal reconstruction from matched filtering of a received signal and a channel impulse response, and before the performance analysis of communication signals, the signal reconstruction performance is examined using probe signals.
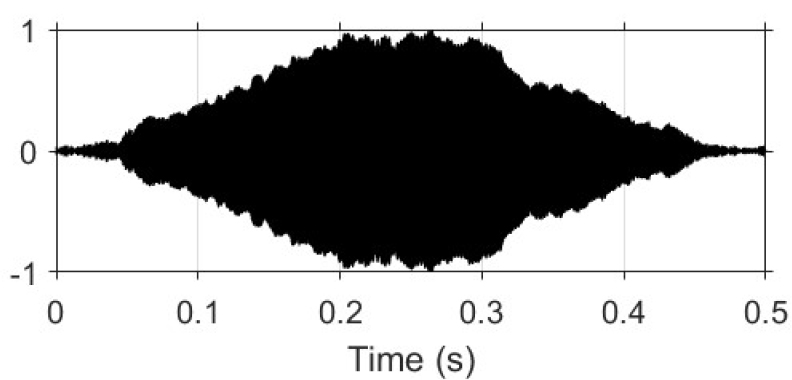
Eq. (4) represents the time reversal processing technique;[26] and denote the spectrum of the received signals and transfer function in all channels, respectively; represents the Hermitian matrix, which is a matrix equal to its conjugate transpose; is the channel numbe; is the final result of time reversal processing, and the reconstructed signal can be obtained by performing the inverse Fourier transform after performing calculations for all frequency components. Fig. 10 shows the results of applying the time reversal processing to the probe signals. Although some distortion is apparent, the overall shape is similar to the probe signal with the application of a 0.5 s-Hanning window. The slight distortion that can be observed in Fig. 10 is presumed to occur because is not a perfect delta function, as in the case of Fig. 9. To quantitatively evaluate the degree of reconstruction, the maximum value of the cross-correlation coefficient between the transmitted probe signal and the probe signal reconstructed through time-reversal processing was calculated using Eq.(5). The maximum cross- correlation coefficient between the result of Fig. 10 and the transmitted signal was approximately 99 %, confirming that the proposed time reversal processing has good performance.
From the result of Figs. 9 and 10, successful signal reconstruction can be confirmed, serving as a metric that allows prediction of the successful demodulation of communication signals.
4.2 Results of communication performance analysis
As can be observed from the results obtained using the probe signal as in the previous section, time reversal processing, which is known to derive an optimal solution, was used for the communication performance analysis. Before time reversal processing, Doppler estimation as described in Section 3.2 was performed for each channel and the Doppler effect is compensated in the received signal. Because time reversal processing has the same principle as the equalizer, in theory, it can also be referred to as a self-equalizer.[29] However, in practice, residual Inter-Symbol Interference (ISI) remains even after time- reversal processing. To eliminate this, the single-channel decision feedback equalizer is mainly applied, and the combination of time reversal processing and equalizer is known as the optimal solution[25,26]. In this study, after time reversal processing, the decision feedback equalizer was applied using the training symbols located in the front part of the payloads to analyze the communication performance. In particular, an adaptive algorithm of recursive least squares with the forgetting factor of 0.99 was employed, and the numbers of feed forward and feedback filter taps were designed to be 20 and 10, respectively.
Fig. 11 displays scatter plots of the results of applying the time reversal processing and decision feedback equalizer to two types of PSK modulation and two types of QAM. Figs.11(a) and 11(b) show the results of the QPSK and 8PSK modulation types, respectively, and Figs.11(c) and 11(d) present the results of the 8QAM and 16QAM types, respectively. In the case of PSK modulation, an error symbol does not appear, and it can be observed that the estimated symbols form around the information symbol. This indicates that the output SNR, which expresses how widely the estimated symbols are distributed from the information symbols, of these signals is large.[28] Conversely, in the case of 8QAM among the QAM types, there was no error symbol, but for 16QAM, 403 bit errors occurred out of 20,800 bits. Although both 8PSK and 8QAM use three bits per symbol, the difference between the two types of modulation is that 8QAM includes amplitude modulation in addition to phase modulation. The amplitude modulation is ultimately determined by the influence of the background noise level. Because ACUA- EX20 is a favorable environment with an SNR of 10 dB or more, the performances of the two modulation schemes were similar. In the case of 16QAM, which is more sensitive to noise because the Euclidean distance is shorter than that of 8QAM, some bit errors occurr. However, because it shows a low Bit Error Rate (BER) of approximately 2 %, it can be infered that 16QAM, which is a challenging higher-order modulation, was also successfully demodulated. Table 1 summarizes the results of the BER and output SNR for each modulation type. From all the results, the feasibility of higher-order modulation to increase the data rate was verified in long-range underwater acoustic communication.
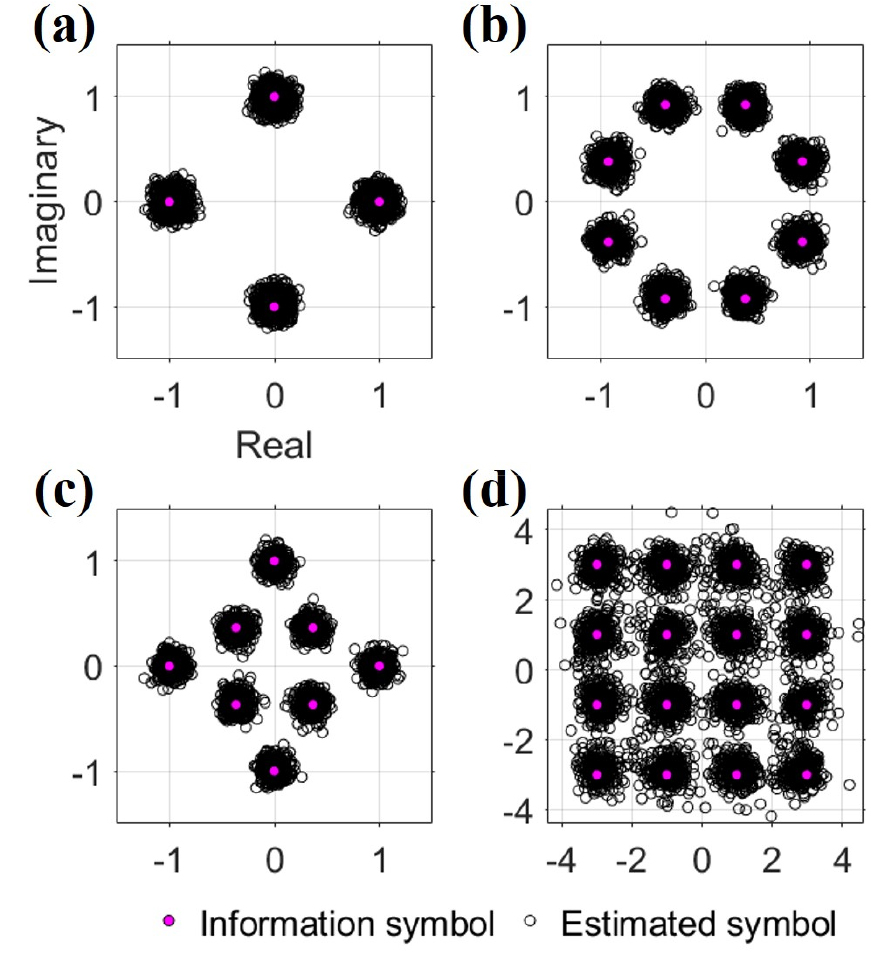
Table 1.
Bit Error Rate (BER) and output SNR according to the modulation type.
| Modulation | BER | Output SNR |
| QPSK | 0/10400 (0 %) | 18.9 dB |
| 8PSK | 0/15600 (0 %) | 18.9 dB |
| 8QAM | 0/15600 (0 %) | 18.5 dB |
| 16QAM | 403/20800 (1.94 %) | 12.3 dB |
For approximate comparative analysis on the level of the signals designed in this study, Fig. 12 depicts a comparison with the results of overseas studies in a similar environment, and Table 2 outlines the signal design specifications and transmission range in this study and existing overseas studies. A similar deep-water environment was defined in this study with a range of less than 50 km and a water depth of 1,000 m or more. The black dashed line in Fig. 12 indicates the metric (range-rate product) proposed in Reference [2], and the yellow star-shaped values denote the specifications of the signals used in this study. To show the results of overseas studies, BPSK, QPSK, and 8PSK modulation schemes are indicated in red, blue, and green, respectively, and the results of Shimura and Plaisant are indicated by circles and triangles, respectively. When compared with the results of overseas studies in similar environments, the data rates of the signals designed in this study were high. In addition, the enlarged figure in Fig. 12 shows that the date rate exceeded the metric values presented in Reference [2]. However, because the results in Fig. 12 do not include the sea environment and system specifications, such as frequency, bandwidth, source level, and array arrangement, apart from the signal design, there are limitations in terms of comparison between the different results. Therefore, only the confirmation on the approximate level is possible at this stage, to improve precision, comparisons should be made considering the sea environment and system specifications.
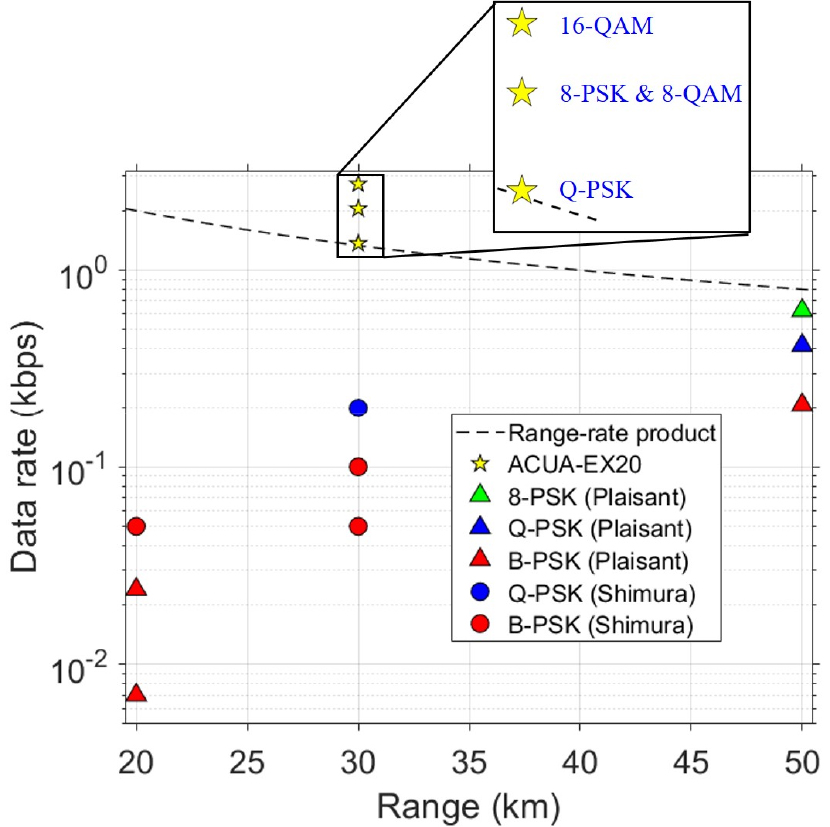
Table 2.
Range and specification in studies shown in Fig. 12.
V. Conclusions
In long-range underwater acoustic communication, the data rate is reduced because of the narrow bandwidth. To increase the data rate under the condition of limited bandwidth, in this study, we conducted analysis of deep- water long-range communication using higher-order modulation, the performance results of which are presented herein, verifying the feasibility of higher-order modulation in the long-range communication environment in deep water. In addition, we designed two types of PSK and QAM (QPSK and 8PSK, 8QAM and 16QAM) as signals of high-order modulation and used for transmission. The range between the source and receiver was 23 km, and the source was towed in the east direction at the speed of 3 kn. For communication performance analysis, a combination of time reversal processing and a single channel decision feedback equalizer, known as optimal solutions, was employed. Before the application of time reversal processing, a Doppler effect caused by towing the source have to be compensated. Through this process, the BER of 0 % and an output SNR of 18 dB or more were obtained in the modulation schemes except for 16QAM; the highest order modulation; in this case, a BER of less than 2 % and an output SNR of more than 12 dB were obtained. From the above results, the feasibility of higher-order modulation was experimentally verified for increasing data rate in a long-range environment.
