

I. Introduction
II. Proposed method
2.1 Network front-end for sonar signal
2.2 Network architecture
III. Experiments
3.1 Dataset
3.2 Experimental conditions
3.3 Training details
IV. Results & discussion
4.1 Classification performance of the proposed methods
4.2 The effect of variables on the DEMON-style front-end features
V. Conclusions
I. Introduction
In underwater environments such as submarines, passive Sound Navigation and Ranging (SONAR) is one of the most important elements for recognizing surroundings and threats.[1,2] Most of the work using this information was performed by skilled human operators. Their analysis is based on the visual characteristics of signal-processed signals such as Low-frequency Analysis and Recording (LOFAR) or Detection Envelope Modulation On Noise (DEMON).[3] However, these systems have human-related issues such as inconsistency due to a lack of skill or fatigue.[4]
Neural networks have demonstrated remarkable recognition power in various domains, such as image,[5,6] natural language,[7,8,9] and audio domains.[10,11] Their ability to learn complex patterns and make accurate predictions has been proven and they have begun to reduce human labor in many fields. Passive sonar has also been applied to recent neural networks-based algorithm analysis. It could be seen that it is the early stage of applying the algorithm to general acoustic analysis, which is a similar one-dimensional (1D) time series. However, because the physical properties of underwater sound waves are different from those of airborne sound waves, there are inherent limitations in applying existing acoustic analysis methods. In addition, unlike sound, which humans can primarily hear and perceive as a difference, sonar undergoes a transformation that can represent mechanical characteristics, and then analysis is performed on it to find visual differences.
Most studies followed the conventions in general audio analysis. First, the passive sonar waveform is transformed into two-dimensional (2D) features such as a spectrogram[12] by applying a Short-Time Fourier Transform-based (STFT-based) transformation. The focus of this process is to mimic human auditory perception, and features that can express differences in human auditory perception, such as Mel spectrogram and Constant Q Transform (CQT), have shown better performance than raw spectrograms. Another approach is to apply a 1D convolution-based network that can be directly applied to passive sonar signals.[13] However, these approaches can be seen to have limitations: since human hearing is limited to the audible frequency range, systems that mimic this ability cannot fully utilize the information in passive sonar signals, and the data scarcity in passive sonar was a significant hurdle for applying 1D networks, which typically thrive on large datasets, unlike the abundance found in general audio analysis.
In this study, we proposed a novel front-end feature for neural networks that closely resembles the DEMON, a widely used technique for analyzing passive sonar data. The proposed method reflects the physical characteristics of machines underwater, as intended by DEMON, and provides structural flexibility by being composed of operations that can be implemented within a neural network. To the best of our knowledge, this is the first study to model the characteristics of DEMON within a neural network structure. Our contributions are as follows:
1) We propose a DEMON-like front-end feature that improves the performance of passive sonar classification in neural networks.
2) We statistically evaluate the performance of the proposed method in a reproducible experimental setup using strictly partitioned data.
II. Proposed method
2.1 Network front-end for sonar signal
Sonar signals contain a variety of noises, including mechanical noise from machinery, cavity noise from propeller cavitation, and fluid noise from the interaction of fluids with the hull. One way to get the information we want from this complex sonar is to look for distinct visual elements, such as LOFARgram or DEMONgram.
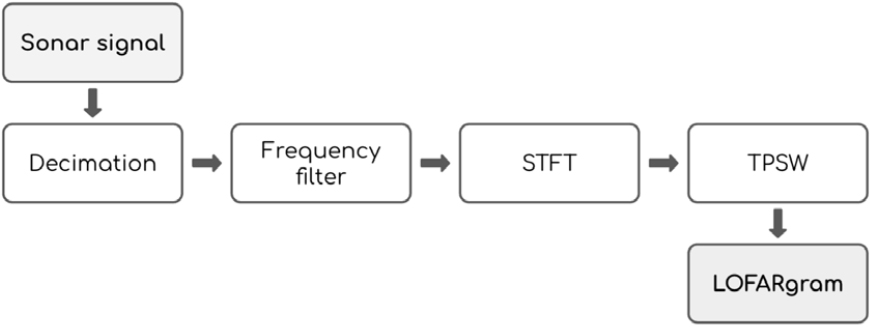
Fig. 1 shows the overall process of obtaining LOFARgram from sonar. First, decimation is performed considering the underwater environment and computational efficiency, extracting specific frequency ranges by applying frequency filters, such as lowpass filter, highpass filter, or bandpass filter, STFT operations are performed considering the target object. After that, post-processing such as Two-Pass Split-Window (TPSW) is performed for more distinct visual elements. This involves a process of emphasizing visual elements during computation but is not fundamentally different from the characteristics of a STFT-based front-end for general audio processing. Therefore, in terms of feature representation, LOFARgram can be considered functionally equivalent to a standard spectrogram.
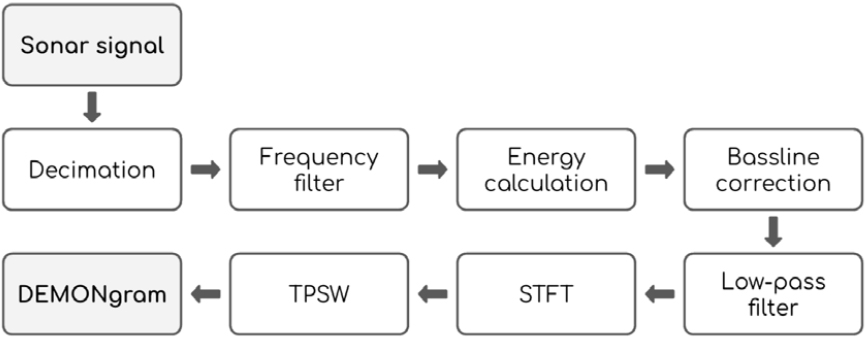
Unlike LOFARgram, which directly analyzes sound frequency components, DEMONgram focuses on extracting characteristics indicative of propeller cavitation.[14] As shown in Fig. 2, DEMON performs energy calculation which includes windowing before the STFT, a key difference from LOFAR’s standard STFT approach. This preliminary processing enables DEMONgram to analyze temporally repetitive components within specific frequency bands, rather than simply the original signal’s frequency content.
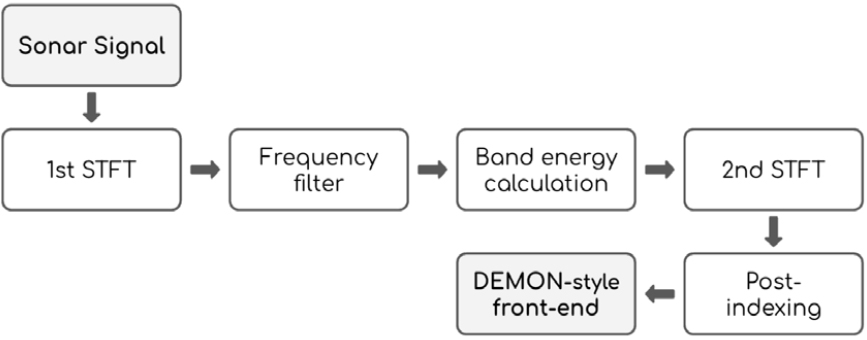
We believe that the unique properties of DEMONgram cannot be expressed by existing spectrogram features. So we implemented a front-end feature that mimics DEMONgram by performing STFT operation twice, which is preferred in Graphic Processing Unit (GPU) computation,[15] as shown in Fig. 3.
Front-end features in neural networks generally refer to features extracted through the front layers of the neural network. They consist of transformations based on fixed operations rather than learnable variables and are responsible for any preprocessing that needs to be performed on the raw data. This is advantageous for large-scale data that require various types of preprocessing and has advantages in terms of storage space required for preprocessing and diversity of preprocessing. In particular, for audio, front-end feature extraction refers to the process of converting a waveform into a spectrogram, which allows for flexible adjustment of the accompanying hyperparameters.[15] To achieve these benefits, we implemented the following DEMON-like feature as a front-end layer within the network, considering computational cost and memory usage.
The first STFT uses a relatively small Fast Frourier Transfrom (FFT) window, as it aims to decimate the signal and select the cavitation frequency to compute the energy over time. One of the advantages of this is that cavitation frequency selection becomes a simple indexing operation, which has computational advantages. After that, the second STFT is performed in the same way as the process of obtaining the original DEMONgram. We do not employ post-processing techniques like TPSW, relying on the network’s capacity to extract essential information directly from the input, rather than relying on visual enhancement. Instead, to improve the efficiency of the network, we reduce the input dimensionality by using a portion of frequency components from a DEMON-like feature. We call this process post-indexing. Post-indexing employs a low-pass filter- like frequency selection process, selecting only a specific portion of the frequency components, to efficiently analyze relevant data by reducing redundant input dimensionality. The post-indexing ratio (rpi) defines the percentage of used frequency components relative to the total number of frequency components. This is because we thought that the important features of DEMONgram mainly exist in the low-frequency band, so we can reduce the size of the result obtained from the second STFT and obtain computational benefits.
Fig. 4 shows the results of the conventional DEMONgram and the proposed DEMON-style feature. As with the conventional DEMON, we can observe characteristics that appear as vertical lines in the low frequency band. That is, we can obtain similar features to the typical DEMONgram in the proposed method and adjust its dimensionality through post-indexing as shown in the figure.
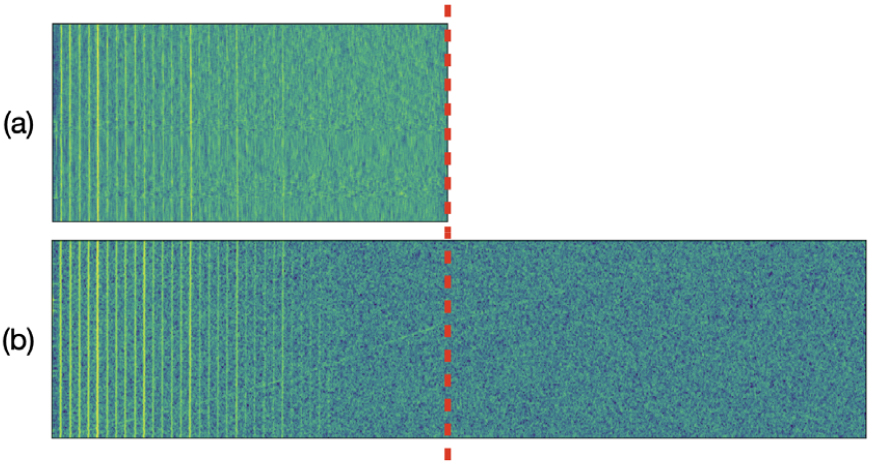
Fig. 4.
(Color available online) The comparison between the conventional DEMONgram (a) and the proposed DEMON-style feature (b) is presented. The DEMONgram was obtained using a 64-point band-pass filter, followed by a 64-point low-pass filter and decimation. This example shows the use of 50 % post-indexing. This technique was used to handle the increased frequency range of DEMON-style features.
2.2 Network architecture
Fig. 5 illustrates the proposed network architecture. The proposed network has an end-to-end structure and extracts Mel spectrogram and DEMONgram, through two front-end layers. Each feature is then analyzed through a separate network and finally connected to predict the final output. In the proposed method, the base model for analyzing each front-end feature refers to any classification network that uses 2D input. The raw waveform input is converted into a typical 2D input by the network’s front-end layer, allowing for the use of diverse 2D classification models. By introducing two parallel front-end layers, we can analyze and leverage information from both the spectrogram and the DEMONgram.
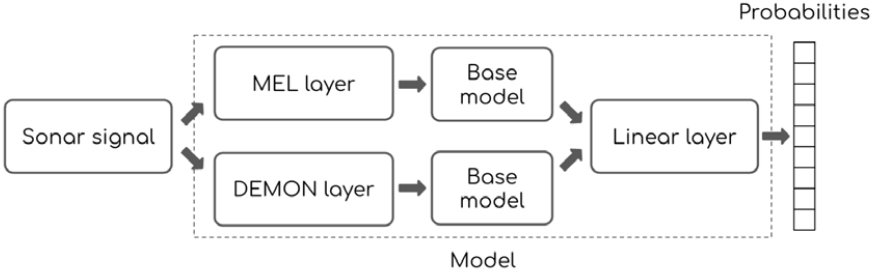
Fig. 5.
Diagram of the proposed network architecture. The sonar signal passes the MEL layer and DEMON layer in parallel, and then extracted features are input into two independent base models. Then the outputs of each model are concatenated to one linear layer and the probabilities of the predicted ship type can be obtained.
III. Experiments
The experiment was designed to verify the effectiveness of the proposed DEMON-style front-end features. Through experiments, we compared the proposed method with existing STFT-based methods, using the common approach of converting sonar data into 2D front-end features and then applying known networks. In this process, we intentionally reduced variables such as augmentation and compared the classification performance according to the difference in front-end features.
3.1 Dataset
We used the ShipsEar[16] dataset, a public dataset for sonar classification. ShipsEar is a dataset of underwater ship sounds collected directly from hydrophones. It consists of 90 sound sources for 11 types of ships, and the total length of the sound sources is approximately 3 h. Unfortunately, there is an imbalance in the number of ships collected per ship, which limits the number of ships available to train the neural network. To ensure a fair comparison of performance and future reproducibility, we followed the data processing methodology used in the previous study.[17]
Target class: A total of 9 classes were used, including 8 ships and ambient noise, excluding 3 ship types (Pilot ship, Trawler, and Tug Boat).
Data split and audio segmentation: To ensure generalization and fair comparison, training, validation, and test sets were split at the audio source level. The samples forming each split were those specified in the previous study.[17] Each sound source was cut into 30-second segments with a 15-second overlap. Samples in less than 30 s were discarded.
3.2 Experimental conditions
In this experiment, we compare the proposed method with Mel spectrogram, a commonly used front-end feature in general audio analysis. This is a spectrogram-based feature that uses a logarithmic frequency scale rather than a linear frequency scale, and is known to be more useful than spectrograms for general audio classification as well as passive sonar classification.[17] MEL is a classification network that uses Mel spectrogram as a front-end. The 30-second sonar data input is first converted into a Mel spectrogram, which is then connected to base models, such as ResNet18,[6] ResNet50V2,[18] or MobileNetV2.[19] After passing through each network structure, the information of each channel is collected through global average pooling and converted into a 1D embedding. This embedding is connected to a fully connected layer corresponding to the 9 classes. DEMON changes the Mel spectrogram to the proposed DEMON-style features under the same conditions.
To compare the information contained in the proposed method and Mel spectrogram, we applied both features simultaneously. In MEL + DEMON, which is the proposed network structure, input sonar data passes two independent layers; the MEL layer and the DEMON layer in parallel, then is converted into Mel spectrogram and DEMON-style features. In this case, the two identical base models are applied to each of the two front-end features, resulting in two embedding vectors. These two embedding vectors are concatenated and connected to 9 outputs through a fully connected layer similar to before. In this case, the entire network is doubled, and the performance of the model can be improved because of the larger model size, not because of the combined features. So, we added MEL + MEL and DEMON + DEMON conditions, which replaced the DEMON layer with the MEL layer and the DEMON layer with the MEL layer, respectively, for a fair comparison. For each condition, either the Mel spectrogram or the proposed method was used in parallel.
3.3 Training details
The parameters required to extract the Mel spectrogram were selected heuristically based on previous studies. For audio with a sample rate of 52,734 Hz, STFT was performed with a size of 2,048 (approximately 40 ms) and an overlap of 50 %, with 300 Mel bins for the 0 kHz ~ 16 kHz band.
In the first STFT for DEMON extraction, the FFT window was 64, the hop size was 32, and we used the energy of components larger than 5 kHz was used. In the second STFT, the FFT window was 2,048, the hop size was 64, and the post-indexing ratio (rpi) was set to 75 %, meaning that the lower 75 % of frequency components were used through post-indexing. These parameters for the experiments, such as window size and hop size for FFT, and rpi were chosen empirically.
Adam Optimizer[20] with learning rate 1e-6 was used, and training was performed for 250 epochs with a batch size of 16. Evaluation was performed using the model that showed the lowest loss in the validation set. For statistical comparison, 5 repeated experiments were performed under each condition.
The experiments were conducted using ResNet50V2 and MobileNetV2 architectures provided by the TensorFlow library, while ResNet18 was implemented by us. During the experiments, the stability and performance were better when the networks were initialized using ImageNet pre-trained weights,[21] so ResNet50V2 and MobileNetV2 were initialized using the weights provided by TensorFlow.
IV. Results & discussion
4.1 Classification performance of the proposed methods
Table 1 shows the experimental results under each condition. Under the same network conditions, MEL always outperforms DEMON. However, for ResNet50V2, the performance of DEMON is almost similar to that of MEL in ResNet18, suggesting that the DEMON-style features contain useful information for sonar classification.
Table 1.
Classification performance results according to front-end features. Performance refers to the average test accuracy and standard deviation of the results repeated five times under the same conditions.
When using the Mel spectrogram only, as in the case of MEL and MEL + MEL, the classification performance gradually improves in the order of ResNet18, ResNet50V2, and MobileNetV2. On the other hand, DEMON and DEMON + DEMON gradually improve the classification performance in the order of ResNet18, MobileNetV2, and ResNet50V2. The DEMON + DEMON method shows better results than the DEMON method in ResNet18 and MobileNetV2 and it seems that is because the network size is doubled, as we mentioned in section 3.2. Based on this, we could assume that the optimal network capacity may vary as we analyze different front-end features.
To analyze DEMON-style features, we assume that a relatively large network such as ResNet50V2 is required, and our results support this by showing performance variation across parallel networks. When using the same two front-end features in parallel, the proposed method shows significant performance improvement on small networks compared to Mel spectrogram.
The proposed method (MEL + DEMON) performed best under all network conditions. Although the difference was statistically significant (Student paired t-test) only under the MobileNetV2 condition, this shows that overall, the two features complement each other and can improve classification performance.
4.2 The effect of variables on the DEMON-style front-end features
The proposed method extracts DEMON-style features using various variables. Among these, we conducted additional experiments to verify the effects of cavitation frequency and post-indexing, varying the values of variables on the proposed method (MEL + DEMON).
Fig. 6 shows the classification performance according to the selection of cavitation frequency when a high-pass filter is applied to the proposed method. In most cases, the more low-frequency components are removed, the better the classification performance. These results are different from the general knowledge that the frequency band reflecting the cavitation phenomenon is 3 kHz to 8 kHz, and this is thought to be due to the distribution of noise components included in the data. We thought we would need a process to set appropriate frequency bands for each data set.
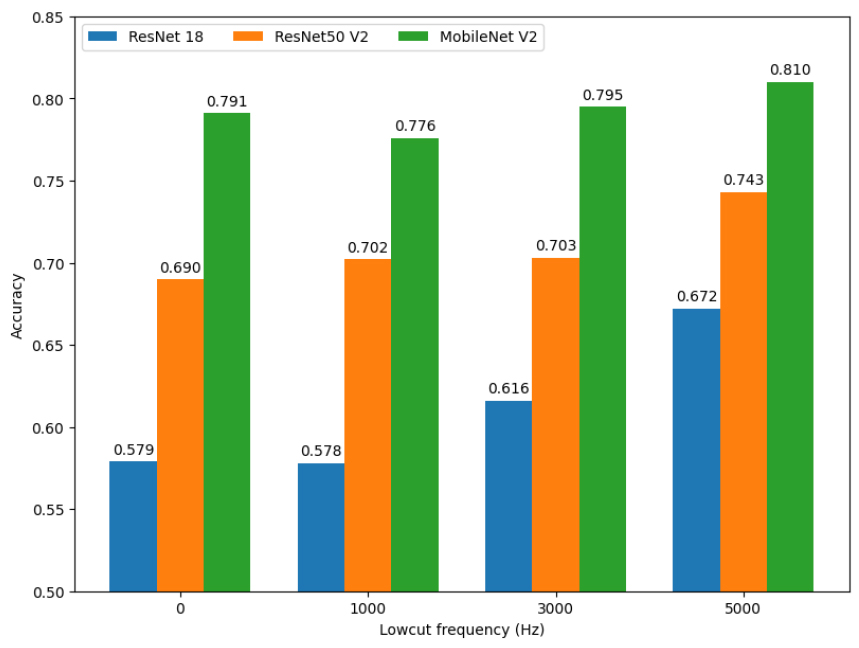
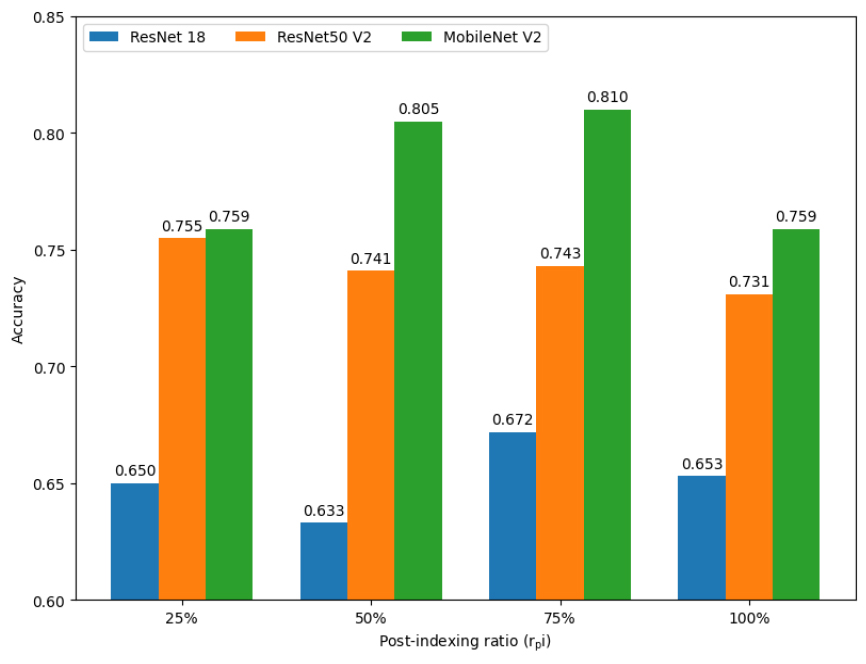
Fig. 7 shows the classification performance according to post-indexing. We applied the various rpi (25 %, 50 %, 75 %, and 100 %) to see the effect of input dimensionality. For example, with the 25 % condition, we choose the values only under 25 % of the maximum frequency. A series of experiments have shown that using more data does not always lead to better results. This is also true for ResNet50V2, which has a relatively large model capacity. We believe that this is a factor related to the amount of data, not just the model capacity. For small datasets like ShipsEar used in this experiment, it may be more effective to reduce the size of the input data, which also requires a process to find the optimal point. If we have sufficient data available, we expect these trends to vary with the amount of data and the size of the model.
V. Conclusions
In this study, we extracted the front-end features of a neural network based on characteristics traditionally specialized for sonar signal analysis and performed passive sonar classification based on these features. Through experiments under various conditions, we demonstrate several valid parameters for extracting DEMON-style features, which have the potential to improve sonar signal classification performance. Since the proposed method is a kind of feature extractor that generates 2D data, it can be applied to any kind of task and network that uses sonar data. We believe that there is a lot of room for improvement in our proposed approach. Since the proposed method is structured as a network, it allows for data-driven tuning rather than requiring a human to find the optimal point. In this experiment, numerous variables influenced the performance, making it challenging to accurately evaluate their impact through repeated trials alone. Another improvement is that we can apply network structure and augmentation methods optimized for DEMON features. We believe there can be many more applications and developments than existing methods.
