I. Introduction
II. Piezoelectric Element-Based Ultrasound Transducers
2.1 Lithium Niobate (LNO) Ultrasound Transducers
2.2 Lead-Magnesium Niobate-Lead Titanate (PMN-PT) Ultrasound Transducers
2.3 Polyvinylidene Difluoride (PVDF) Ultrasound Transducers
III. Discussion
IV. Conclusions
I. Introduction
UltraSound (US) transducers are used in a variety of medical imaging applications.[1] However, some US images are insufficient for biomedical diagnostic purposes.[2] Hence, a variety of methods have been proposed to supplement US imaging and to provide more functional information. PhotoAcoustic (PA) imaging provides high contrast images and combined PA-US systems are used to extract functional and structural information from tissues. Combined PA-US systems have recently been extensively studied from the viewpoint of preclinical and clinical applications.[3] PA imaging involves stimulating biological tissues with a laser beam and collecting the generated PA signal with a US transducer. Conventional US transducers are opaque, which causes two major problems when stimulating tissue with optical beams: (1) Different paths must be provided for the optical beam and sound wave. This requirement leads to increased system volume. (2) When the signal passes through optical and acoustic reflective materials, the Signal-to-Noise Ratio (SNR) of the image is reduced, and image reconstruction becomes necessary to ensure appropriate alignment.
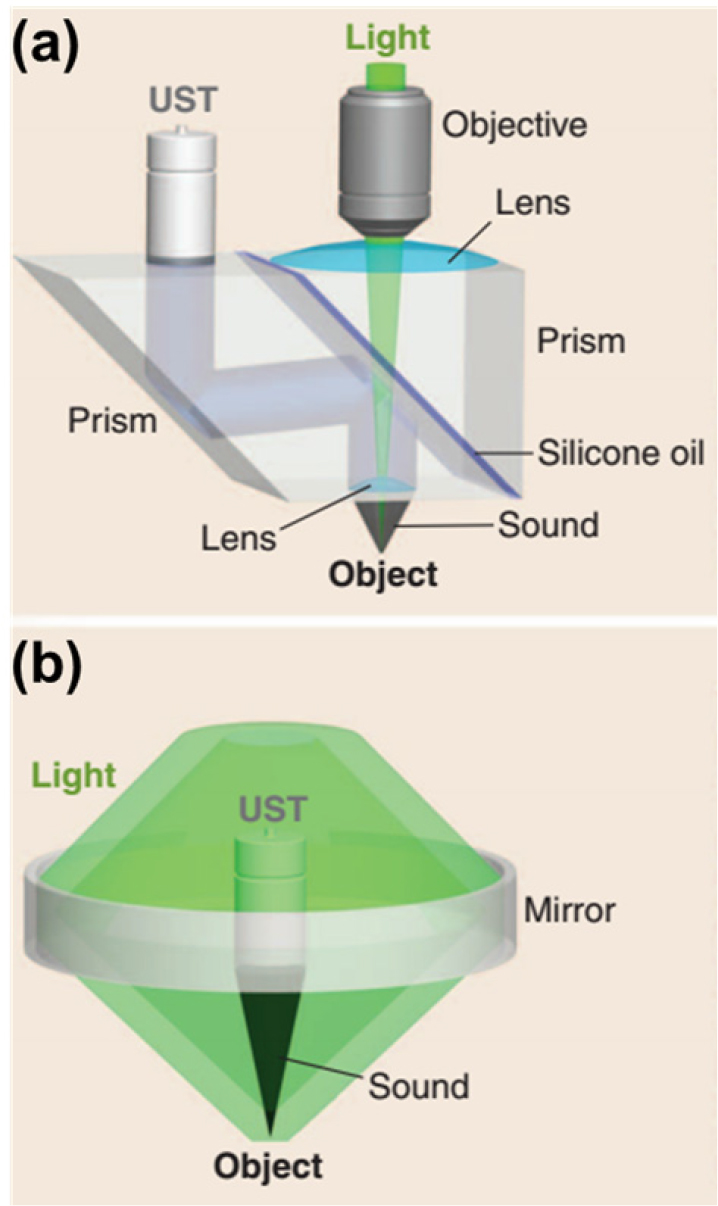
Methods that allow light to bypass a US transducer can be classified into two types: (1) Type-1 methods in which a prism is used to pass light and refracts acoustic signals and (2) Type-2 methods in which donut-shaped mirrors with holes at their centers are set around the US transducer.[4] In Type-1 methods, as shown in Fig. 1(a), the prism glass and silicon oil used in the system have equal optical refractive indexes, but their acoustic impedances are different. Hence, optical transmission is possible, but US is reflected. Type-2 methods, as shown in Fig. 1(b), ideally adopt the coaxial alignment of light and sound by placing donut-shaped mirrors with holes at the centers around the US transducer. In this implementation, since the US transducer is opaque, a mirror is used to reflect sound and light signals, thereby increasing the volume of the entire system and limiting the applications. Using an optically Transparent Us Transducer (TUT) can effectively solve these problems to some extent.
Modern TUTs can simply and effectively receive PA signals. Without additional optical components, TUTs can easily achieve the coaxial alignment of optical and acoustic paths. TUTs can be categorized into two types according to their US sensing mechanisms: (1) TUTs based on active piezoelectric materials and (2) Capacitive Micromachined Us Transducers (CMUTs).[5] The operation of piezoelectric TUTs is based on mechanical changes induced in the piezoelectric materials by applying an alternating current. Ceramics, crystals, and piezoelectric composites are used as piezoelectric elements in most US transducers. The operation of CMUTs is based on changing the capacitance across two conducting plates to which a Direct Current (DC) voltage is applied when exposed to a sound field and when an Alternating Current (AC) signal of the desired frequency is applied.[6] The advantages of CMUTs include low power consumption and high electrical and thermal stability. However, it needs AC poling bias to work.
The aim of this research was to examine optical TUTs in which piezoelectric elements are used. We reviewed 16 papers published from 2014 to the present. Based on the information provided in published papers, we discussed the fabrication characteristics and results briefly.
II. Piezoelectric Element-Based Ultrasound Transducers
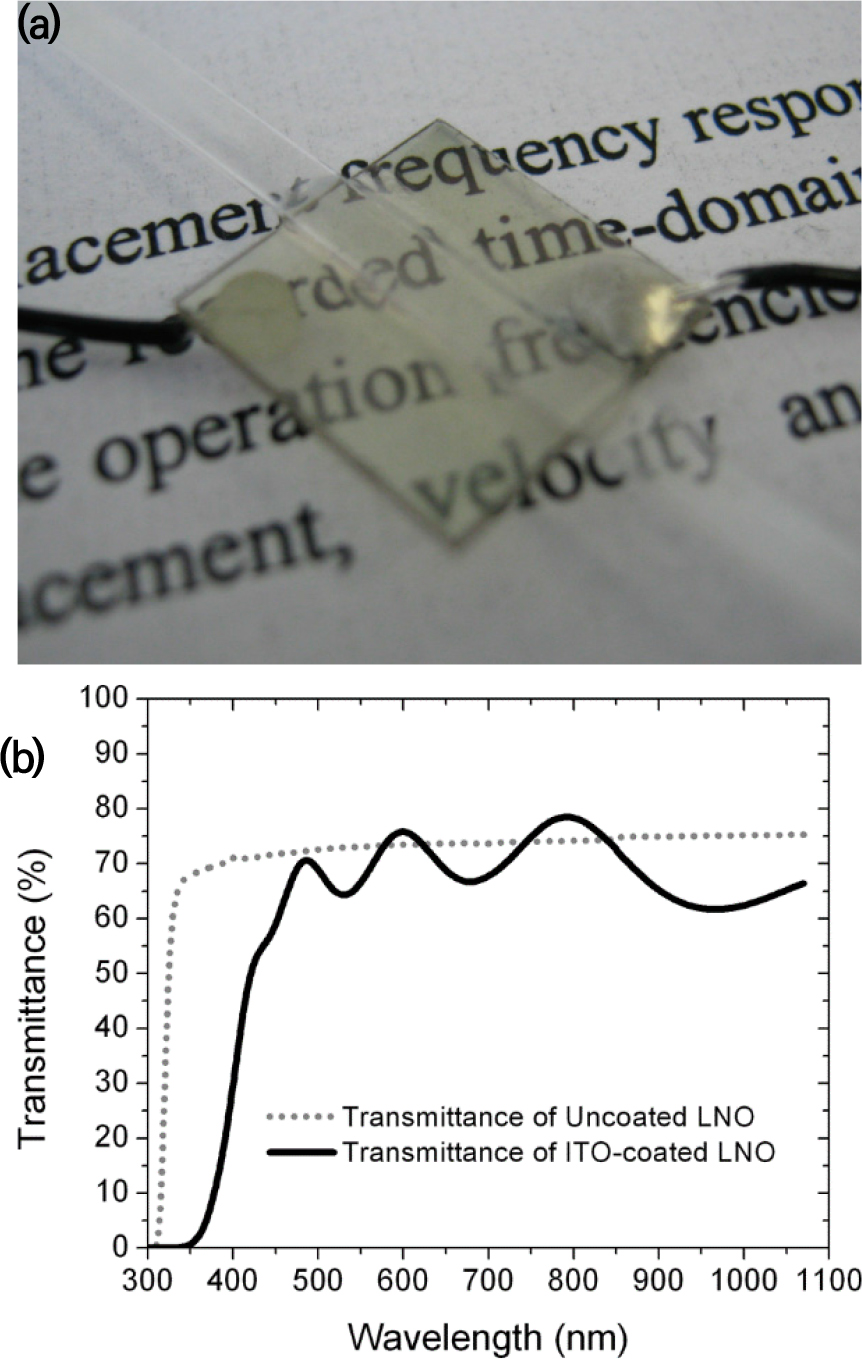
The first transparent transducer was fabricated by Brodie in 2014;[7] the author developed an optical TUT by replacing the existing optically opaque silver electrode with a transparent Indium-Tin Oxide (ITO) electrode [Fig. 2(a)]. Experimental results showed that the electromechanical coupling factor and the generated acoustic performance of the ITO electrode were similar to those of the silver electrode transducers. The optical transmittance of the optical TUT was similar to that of the uncoated piezoelectric element (lithium niobate).
Starting from Reference [7], Lithium Niobate (LNO), Lead-Magnesium Niobate-Lead Titanate (PMN-PT), and Polyvinylidene Difluoride (PVDF) were used as piezoelectric elements for TUT production. ITO and silver nanowires (AgNWs) were used as the electrodes that were attached to the top and bottom of the piezoelectric element. Parylene-C was mostly used as the matching layer, and epoxy (EPO-TEK 301) was used as the backing layer.
2.1 Lithium Niobate (LNO) Ultrasound Transducers
A 36° Y-cut LNO has been used in many US applications because of its high electromechanical coupling coefficient (kt = 0.49), high longitudinal velocity (7340 m/s), and low dielectric constant.[8] LNO is a piezoelectric element with an optical transmittance greater than or equal to 70 %, making it suitable for TUT fabrication [Fig. 2(b)].
The TUTs fabricated in Reference [9] had a center frequency of 14.5 MHz; in these TUTs, ITO was used as the electrode. TUTs of different sizes and shapes were fabricated. In one set of TUTs, the dimensions of the piezoelectric element were 2.5 mm × 2.5 mm, and the optical fiber was directly fixed to the back of the TUT using EPO-TEK 301 [Fig. 3 (a)], and three-Dimensional (3D) PA images were acquired by moving it simultaneously. In the other set of TUTs, the dimensions of the piezoelectric element were 10 mm × 10 mm. The optical fiber was moved along the back of the TUT to obtain 3D PA images. Both TUTs achieved an optical transmittance of approximately 80 %.
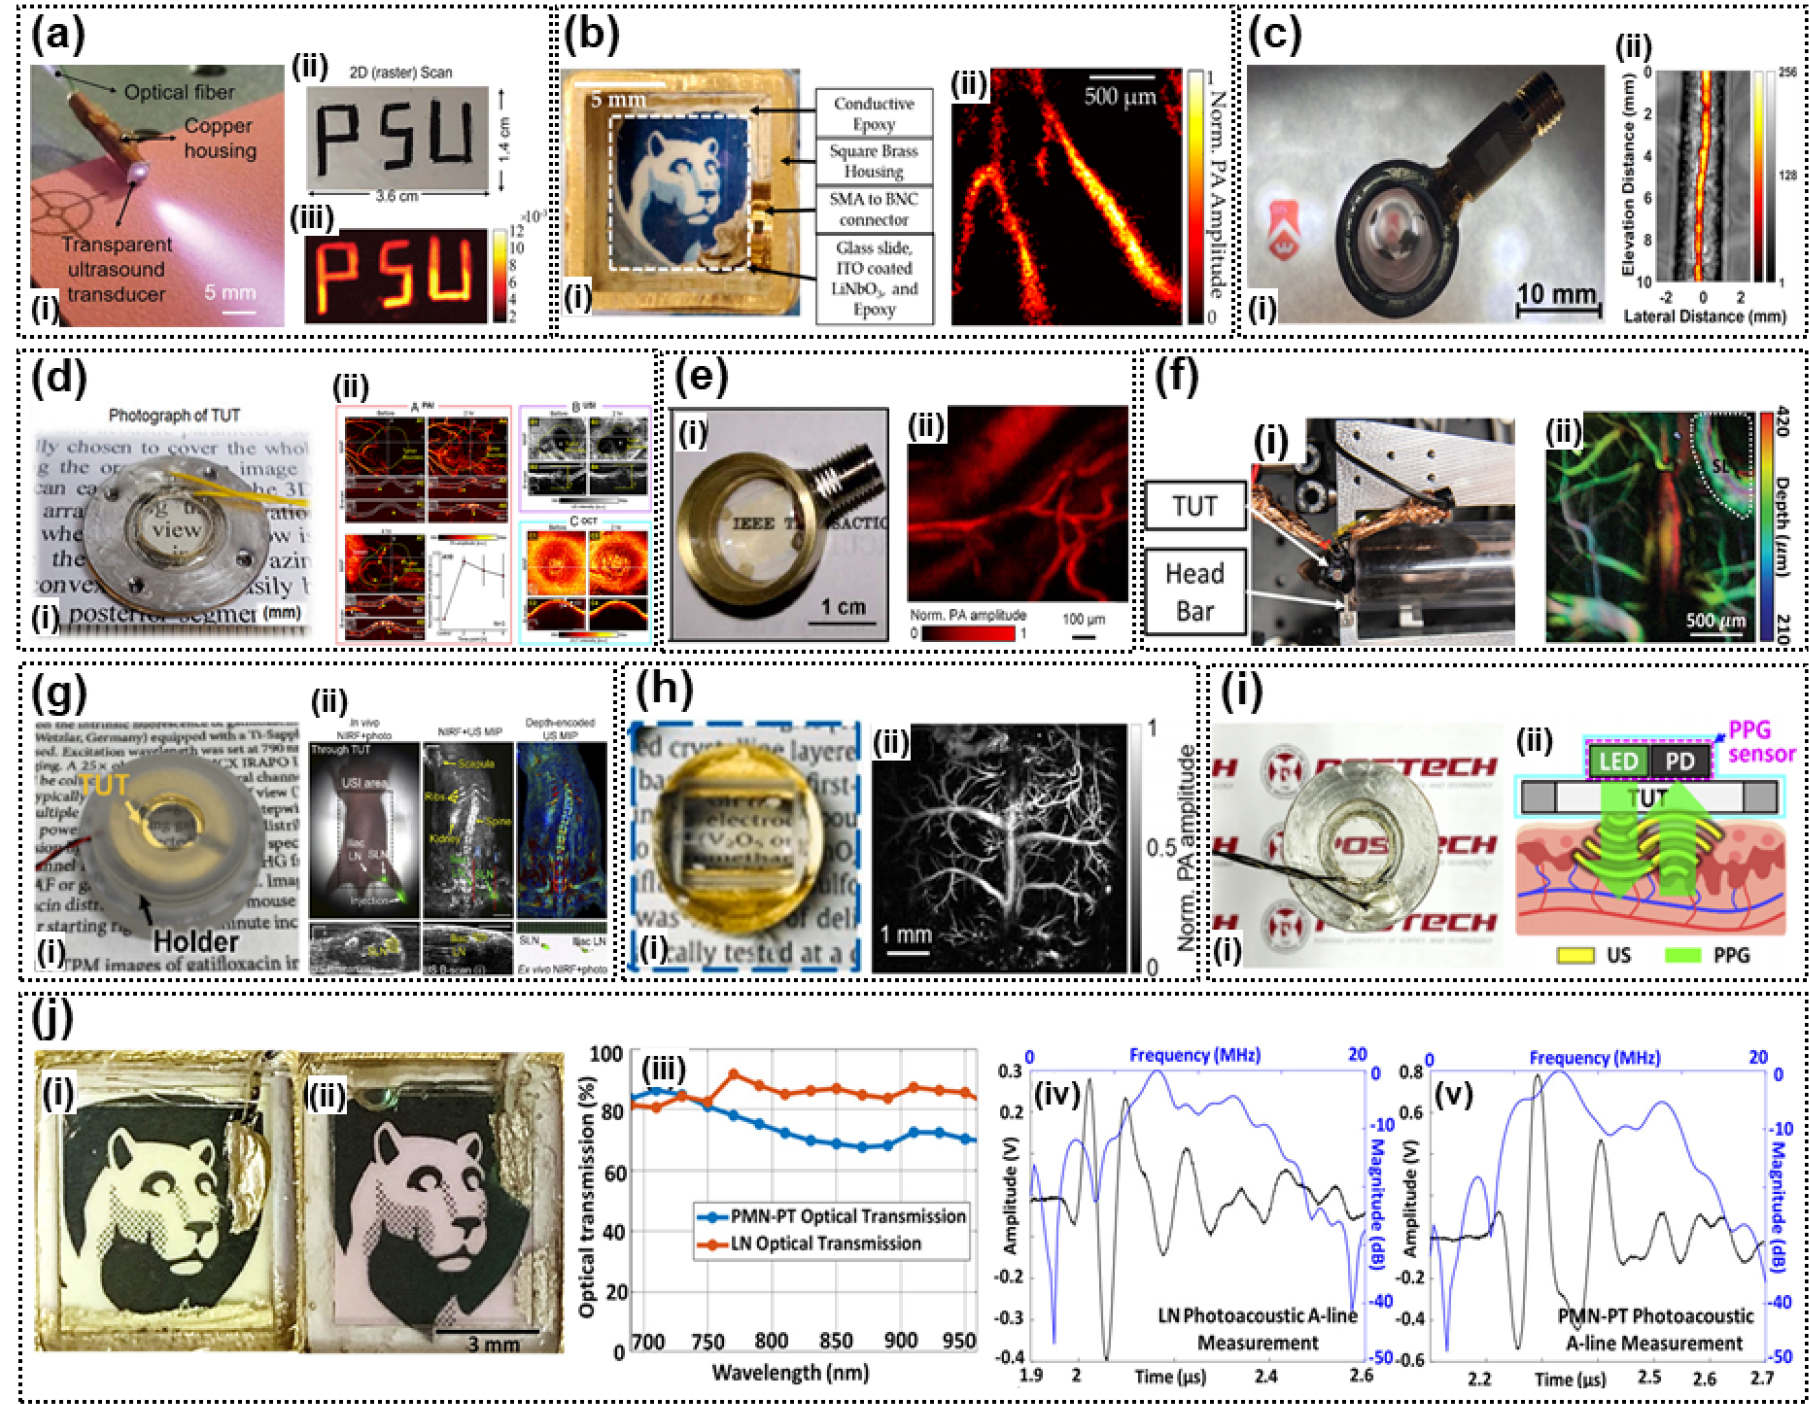
Fig. 3.
(Color available online) Transparent ultrasound transducers (TUTs) fabricated in different studies. (a) LNO TUT: (i) an LNO_ITO TUT and (ii) raster scanning of text “PSU,” (iii) photoacoustic (PA) image.[9] (b) LNO TUT: (i) an LNO_ITO TUT and (ii) a PA image of chick-embryo chorioallantoic membrane.[10] (c) LNO TUT: (i) an LNO_ITO TUT and (ii) a PA image of mouse tail.[11] (d) LNO TUT: (i) an LNO_silver nanowires (AgNWs) TUT and (ii) in-vivo quadruple fusion imaging of eyes of rats before and after alkali burns.[12] (e) LNO TUT: (i) LNO_ITO TUT and (ii) a PA image of mouse ear.[13] (f) LNO TUT: (i) Setup for restraining the head of a mouse and (ii) a PA image of mouse brain.[14] (g) LNO TUT: (i) LNO_ITO TUT and (ii) In-vivo sentinel lymph nodes (SLN) localization and dissection using bi-modal near-infrared fluorescence (NIRF) and US imaging.[15] (h) LNO TUT: (i) LNO_ITO TUT and (ii) a PA image of mouse brain.[16] (i) LNO TUT: (i) LNO_ITO TUT, (ii) an illustrative diagram of the opto-US sensor integrating a photoplethysmography (PPG) sensor and a TUT.[17] (j) LNO, lead-magnesium niobate-lead titanate (PMN-PT) TUT: (i) LNO_ITO TUT, (ii) PMN-PT_ITO TUT, (iii) comparison of optical transmission of the TUTs, (iv) PA A-line responses for the LNO TUT, and (v) PA A-line responses for the PMN-PT TUT.[18]
In Reference [10], a TUT based on the thesis of Reference [9] with a center frequency of 13 MHz was proposed. The electrode of the fabricated TUT was made of ITO, and a new Optical-Resolution PhotoAcoustic Microscopy (OR-PAM) measurement method was developed. To verify the measurement method, the TUT was fixed on the imaging target, and the light source was moved to acquire a 3D PA image. A carbon-fiber imaging experiment showed a lateral resolution of 8.5 µm. The performance of OR-PAM was verified by tissue phantom imaging and vascular structure imaging using chicken embryos [Fig. 3 (b)].
The TUT proposed in Reference [11] has a center frequency of 11 MHz and uses ITO as the electrode material. For performance verification with Acoustic-Resolution PhotoAcoustic Microscopy (AR-PAM), an Acoustic Lens (AL) was used to focus the US signal, and an EPO-TEK 301 backing was used. Because of the curvature of the AL, the optical transmittance was 66 %. The lateral resolutions of the US and PA images was 198 µm and 242 µm. The performance of AR-PAM was verified by using silicon tube ink and mouse tail images [Fig. 3 (c)].
In Reference [12], the proposed TUT has a center frequency of 31.5 MHz and uses AgNW electrodes. To increase the resolution of the US transducer, an AL was used; the AL coated with Parylene-C (thickness of 21 µm) was used for matching. The optical transmittance of the TUT was 70 %. The axial and lateral resolutions of the US images were 890 µm and 130 µm, respectively. A quadruple fusion image system was implemented using the TUT. The integration of the US and PA images through the TUT with optical tomography images and fluorescence images passed through the TUT was experimentally verified. Furthermore, the authors comprehensively monitored the multivariate response to chemical and suture injuries, such as corneal neovascularization, structural changes, cataracts and inflammation, to rat eyes in-vivo. As the next application, the multimodal imaging of tumors in-vivo by visualizing melanoma without labeling and the visualization 4T1 breast carcinoma using PEGylated gold nanorods were examined [Fig. 3 (d)].
The element size of the TUT proposed in Reference [13] was 10 mm × 10 mm, and the center frequency was 36.9 MHz. ITO electrodes were used. Parylene-C and EPO-TEK 301 were used as the matching and backing layer, respectively. The developed TUT had a maximum optical transmittance of 90 % at a wavelength of 600 nm. The performance of the TUT was verified by considering the target resolution and PA imaging of mouse ear vasculature [Fig. 3 (e)].
Further, in Reference [14], a TUT with an element size of 3 mm × 3 mm and center frequency of 13 MHz was proposed. This TUT had ITO electrodes. EPO-TEK 301 was used as the backing layer. Conventional mouse brain imaging heads are not suitable for OR-PAM because of the differences between the acoustic impedances of the glass plate and tissue. To solve this problem, we propose using a mouse brain imaging head made of TUT. The TUT cranial window can drastically simplify the imaging head because of the dual function of the optical window and US transducer. The axial and lateral resolutions of the PA image of the proposed TUT were 202.5 µm and 6.9 µm, respectively. The performance of the TUT was verified by leaf phantom imaging, mouse brain PA imaging, and two-photon microscopy imaging [Fig. 3 (f)].
The TUT proposed in Reference [15] had an element diameter of 9 mm and a center frequency of 13 MHz; ITO electrodes were used. The matching and backing layers were made of glass and EPO-TEK 301. The optical transmittance of the TUT was 80 %. A near-infrared (near-IR) fluorescence and US image fusion system was implemented using the TUT. The deep-tissue Near-IR Fluorescence (NIRF) Imaging of Indocyanine Green (ICG)-filled Eppendorf tube chicken breast tissue of various thicknesses confirmed a 20 % decrease in the intensity of the images that passed through the TUT compared to the images without it. A phantom composed of two crossed microtubes was filled with water and ICG to verify the NIRF and US fusion image performances. We also verified that the Sentinel Lymph Nodes (SLN) of ICG-injected mice were successfully localized and dissected based on the information obtained from the bimodal imaging system [Fig. 3 (g)].
The TUT proposed in Reference [16] has an element size of 10 mm × 10 mm, a center frequency of 34 MHz, and an ITO electrode. Parylene-C and EPO-TEK 301 were used for the matching and backing layers, respectively. The photoacoustic signal was uniformly received by the TUT element through an AL. The axial and lateral resolutions of the PA image were 208 µm and 12.5 µm, respectively. The developed OR-PAM system achieved a multifaceted frame rate of 500 Hz over a scan area of 9 mm. The performance of the developed TUT system was verified by PA imaging of the mouse brain and vasoconstriction imaging of the mouse ear after epinephrine injection [Fig. 3 (h)].
In wearable medical electronic devices, body signals are measured using various fusion sensors such as the Photoplethysmography (PPG), US sensor, camera, and accelerometer. However, when small wearable devices are desired, the integration of multiple sensors becomes a challenge. In Reference [17], we propose two new opto-US sensors: a wearable PPG_US device and a PPG-sensor-embedded mobile smartphone that are integrated using a TUT. The proposed TUT has a center frequency of 6 MHz and uses a transparent ITO electrode. EPO-TEK 301 was used as the backing layer, and glass and Parylene-C were used as the matching layer. The optical transmittance of the TUT was 82 %. Using these two devices, we measured the heart rate of human subjects based on visual and, audio signals and quantified oxygen saturation optically based on the light passing through the TUT. Thus, we verified the performance these devices [Fig. 3 (i)].
The LNO-based TUT has low SNR because of its low piezoelectricity (d33). Therefore, a TUT was fabricated using PMN-PT, and the performances of the two TUTs were compared. The element size of the LNO TUT proposed in Reference [18] is 3 mm × 3 mm, and its center frequency is 7.2 MHz/11.8 MHz; the TUT has ITO electrodes, an EPO-TEK 301 backing layer, and a glass, Parylene-C matching layer. The element size of the PMN-PT TUT is 3 mm × 3 mm, and its center frequency is 7.8 MHz/13.2 MHz; this TUT uses ITO electrodes, an EPO-TEK 301 backing layer, and a glass, Parylene-C matching layer; this structure is similar to that of the LNO TUT. The optical transmittances of the LNO TUT and PMN-PT TUT were 80 % and 70 %, respectively. Comparison of the pulse echo of the two TUTs showed that the SNR of the PMN-PT TUT was 8.9 dB higher. Furthermore, in PA measurements, the SNR of the PMN-PT TUT was 5.2 dB higher. In addition, in PA imaging experiments with phantom targets, PMN-PT-TUT and LNO-TUT exhibited lateral resolutions of 7 µm and 5.1 µm, respectively, and axial resolutions of 285.6 µm and 375.9 µm, respectively. These results verify that PMN-PT is a suitable replacement for LNO to develop TUT systems [Fig. 3 (j)].
2.2 Lead-Magnesium Niobate-Lead Titanate (PMN-PT) Ultrasound Transducers
PMN-PT is used in TUT research because it has a higher kt (0.60) than that of LNO (kt = 0.49) . In Reference [18], PMN-PT was used in the TUT because of its numerous advantages over LNO.
The PMN-PT TUT proposed in Reference [19] has an element size of 4 mm × 4 mm and a center frequency of 27.6 MHz. It uses ITO electrodes, an EPO-TEK 301 backing layer, and a Parylene-C matching layer. The difference between the presence and absence was compared. The optical transmittance was 67 % at 532 nm. The kt values corresponding to different bias voltages of the TUT were measured; it was confirmed that the maximum kt value was obtained for a voltage of 100 V. Comparison of the TUT with and without the matching layer showed that the TUT with the matching layer could measure a signal about twice as high as that measured by the TUT without the matching layer; similarly, the TUT with the matching layer measured about twice the PA signal that was measured by the TUT without the matching layer [Fig. 4 (a)].
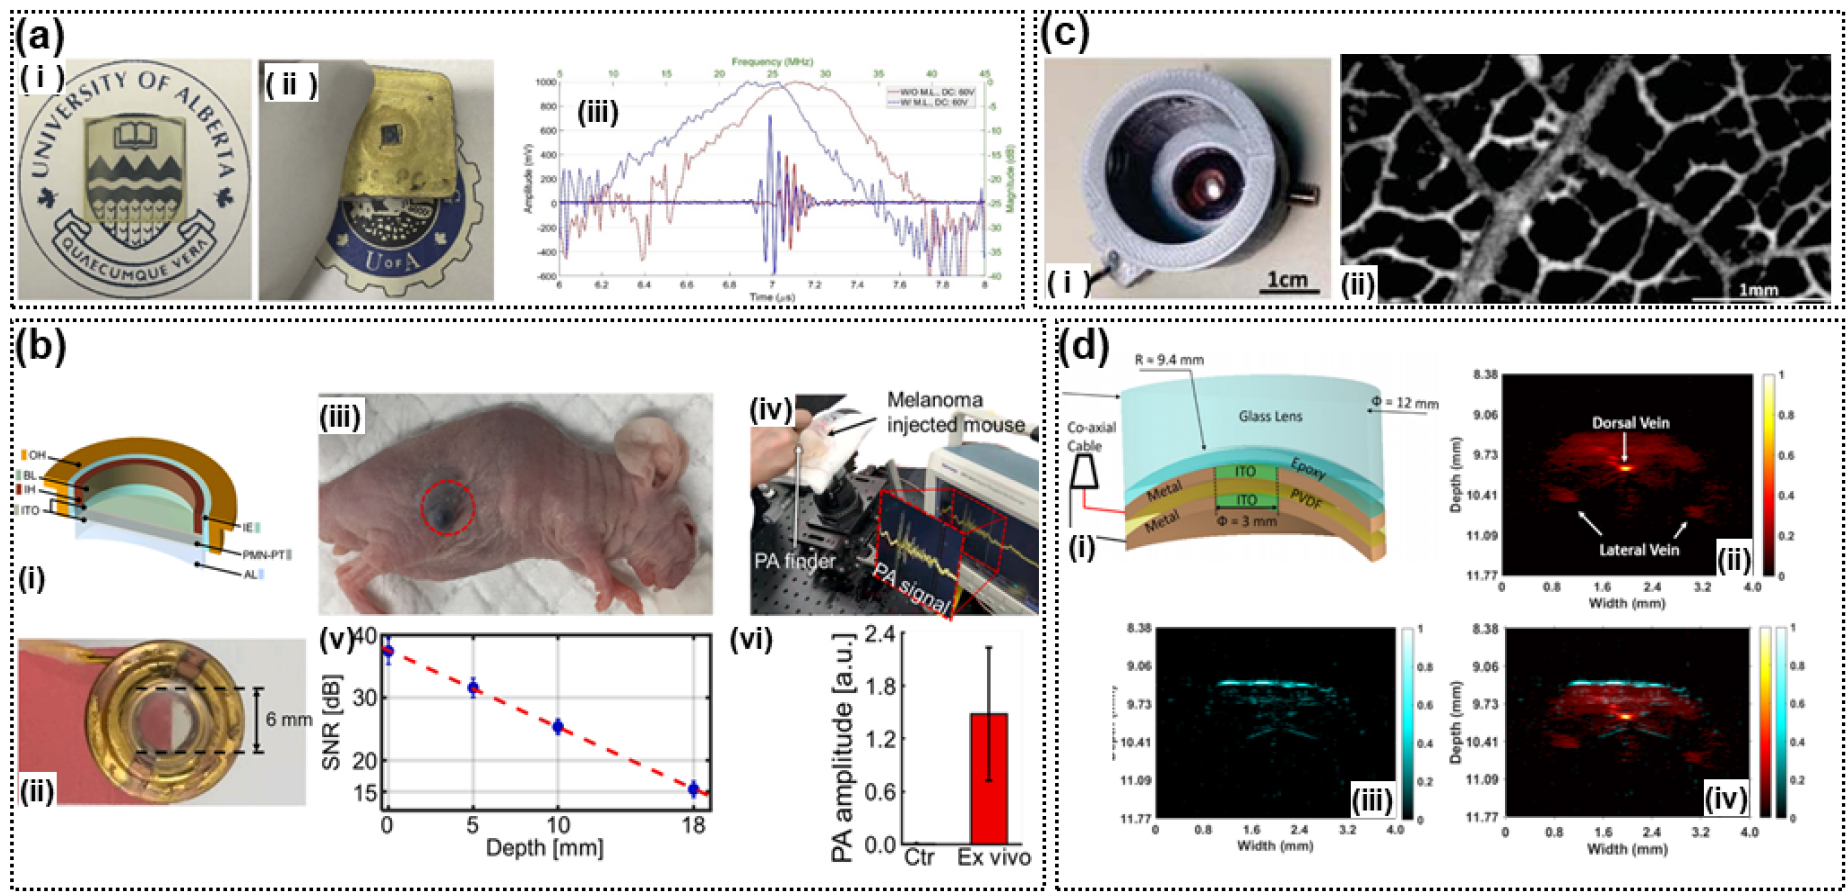
Fig. 4.
(Color available online) TUTs fabricated in different studies. (a) PMN-PT TUT: (i) PMN-PT and ITO, (ii) PMN-PT and ITO TUT, and (iii) PA A-line responses.[19] (b) PMN-PT TUT: (i) Layer-wise view, (ii) PMN-PT TUT, (iii) melanoma (circled in red), (iv) a screenshot showing the video recording of the experiments, (v) estimated PA SNRs, and (vi) ex-vivo PA amplitude of the dissected melanoma tissue.[20] (c) Polyvinylidene difluoride (PVDF) TUT: (i) PVDF and ITO TUT and (ii) PA image of leaf skeleton,[21] (d) PVDF TUT: (i) PVDF and ITO TUT, (ii) PA image of mouse tail, and (iii) US image of mouse tail, (iv) combined images of the mouse tail.[22]
In Reference [20], a portable PA meter was developed by integrating a solid-state dye laser and a TUT. The laser equipment was integrated into the TUT and the handpiece. The fabricated TUT element had a diameter of 6 mm, and a center frequency of 8 MHz. It used an ITO electrode. EPO-TEK 301 was used as the backing layer, and Parylene-C was used as the matching layer. AL was used for acoustic focusing. The integrated sensor detected a methylene blue (MB)-filled tube placed under 22-mm-thick chicken tissue. In live animals, we photoacoustically detected both SLNs injected with MB and subcutaneously injected melanomas [Fig. 4 (b)].
2.3 Polyvinylidene Difluoride (PVDF) Ultrasound Transducers
In Reference [21], a focusing TUT was fabricated with a pair of lenses by cutting a 9 µm -thick PVDF layer. The TUT had a diameter of 6 mm. The transparent part is 3 mm in diameter and is composed of ITO coating. The lateral resolution of the PA image was 4.2 µm, and the performance was verified by measuring the leaf phantom [Fig. 4 (c)].
The TUT developed in Reference [22] has a higher frequency of 36 MHz and a higher NA (0.64) than that fabricated in Reference [21]. The axial and lateral resolutions of the former TUT [22] were 17.7 µm and 37.8 µm, respectively. To verify the developed TUT with an PA axial resolution of 39.1 µm, images of a wire target under chicken tissue and mouse tail were acquired [Fig. 4 (d)].
III. Discussion
In the field of photoacoustics, the TUT provides the same path for both light and acoustic sensing, and hence, this device is of great interest.[23] In general, the piezoelectric element used to fabricate the TUT is limited. The TUT should be optically transparent and should have a high kt value. The commonly used piezoelectric elements are LNO, PMN-PT, and PVDF. The light transparency of LNO is approximately 80 %, and PMN-PT has a high transparency of 90 % at 532 nm.[5] The light transparency of PVDF is approximately 80 %, which is similar to that of LNO, and it is a major piezoelectric element when manufacturing flexible TUTs. In manufacturing and using the TUT, piezoelectric characteristics must also be considered to achieve a wide frequency bandwidth. The piezoelectric properties of LNO are (approximately 400 pC/N) and those of PMN-PT are (>2100 pC/N); this allows us to fabricate a wide-bandwidth TUT.[5] In addition, using an LNO with kt = 0.49 and a PMN-PT with kt = 0.60, a highly sensitive TUT can be fabricated. PMN-PT is especially suitable in the low-frequency range, due to its high electromechanical and dielectric properties compared to LNO and PVDF.[20] LNO, PVDF are applicable in the high frequency (>30 MHz) range. Flexible PVDF is suitable for concave-type focused ultrasound transducers.[21,22] The type and performance of different transparent piezoelectric materials are summarized in Table 1. In many studies, EPO-TEK 301 was used as the backing layer for the TUT; however, to build a wide-bandwidth TUT, it is necessary to explore materials with low US attenuation. In addition, EPO-TEK 301 shrinks during hardening; this can cause the problem of diffraction of light.[9] The matching layer has mostly been fabricated using glass (≈12 MRayls) and Parylene-C (≈2.8 MRayls). In the case of using two matching layers, the following equation is used to match the water and acoustic impedance.
where Zp and Zware acoustic impedance of piezoelectric material (34 MRayls) and the water (1.4 MRayls), respectively. The value obtained by the calculation formula is 8.7 MRayls for the first matching layer and 2.2 MRayls for the second matching layer. Glass used as the matching layer is the first matching layer, and Parylene-C corresponds to the second matching layer. Attenuation and distortion may occur due to differences in acoustic impedance between the calculated value and the matching layer used. Therefore, research on materials with low US attenuation and high matching performance is required. PVDF has a low acoustic impedance and a wide bandwidth but a low SNR in US images because of its low kt value. The type and performance of different TUTs are summarized in Tables 2, 3.
In this review, we have focused on the use of TUTs in combined US and PA imaging. However, TUTs can also be used for combined US and optical imaging and therapy. For instance, a probe that integrated an Intravascular Ultrasound(IVUS) transducer and optical fiber for Optical Coherence Tomography (OCT) has been developed for simultaneous IVUS-OCT imaging. For this, the IVUS transducer and OCT fiber should be placed side-by-side within the probe.[24] This configuration inevitably causes misalignment of the IVUS and OCT images, which can be solved if a TUT is employed for IVUS imaging. Additionally, TUTs can be used for the light penetration increase assisted by US.[25,26,27]
Table 1.
Properties of transparent piezoelectric materials.
|
Piezoelectric material |
Average transparency (%) |
piezoelectric constant (d33) |
piezoelectric voltage constant(g33) |
coupling coefficient (kt/k33) |
longitudinal sound speed (m/s) | Ref |
| LNO | 80 | <350 pC/N | 30.3 Vm/N | 0.49/0.47 | 7340 | [5], [18], [23] |
| PMN-PT (DC-poled) | 70 | 1500 pC/N | 41 Vm/N | 0.60/0.94 | 4600 | [5], [23] |
| PMN-PT (AC-poled) | 70 | 2200 pC/N | 30.4 Vm/N | 0.60/0.94 | 4600 | [5], [23] |
| PVDF | 80 | 27 pC/N | <122 Vm/N | -/0.16 | - | [5], [23] |
Table 2.
Production method of TUTs.
| Ref | Piezoelectric material (size, thickness) | Electrodes |
Matching layer (thickness) | Backing layer |
Acoustic focusing |
| [7] | LNO (10 mm × 10 mm, 500 μm) | ITO/Ag | - | - | - |
| [9] | LNO (2.5 × 2.5 mm, 250 μm / 10 mm × 10 mm, 250 μm) | ITO | - | EPO-TEK 301 | - |
| [10] | LNO (10 mm× 10 mm, 250 μm) | ITO | - | EPO-TEK 301 | - |
| [11] | LNO (7 mm× 7 mm, 280 μm) | ITO | - | EPO-TEK 301 | Acoustic lens |
| [12] | LNO (diameter of 9 mm, 130 μm) | silver nanowires | Parylene (21 μm) | EPO-TEK 301 | Acoustic lens |
| [13] | LNO (10 mm × 10 mm, 100 μm) | ITO | Parylene (16 μm) | EPO-TEK 301 | - |
| [14] | LNO (3 mm × 3 mm, 250 μm) | ITO | Parylene (40 μm) | EPO-TEK 301 | - |
| [15] | LNO (diameter of 9 mm, 130 μm) | ITO | Glass (100 μm), Parylene (10 μm) | EPO-TEK 301 | - |
| [16] | LNO (10 mm × 10 mm, 100 μm) | ITO | Parylene (10 μm) | EPO-TEK 301 | Acoustic lens |
| [17] | LNO (diameter of 9 mm, 250 μm) | ITO |
Glass (100 μm), Parylene | EPO-TEK 301 | - |
| [18] | LNO (3 mm × 3 mm, 100 μm), PMN-PT (3 mm × 3 mm, 100 μm) | ITO |
Glass (100 μm) Parylene (40 μm) | EPO-TEK 301 |
- - |
| [19] | PMN-PT (3.5 mm × 3.5 mm, 100 μm) | ITO | - Parylene (20 μm) | EPO-TEK 301 |
- - |
| [20] | PMN-PT (diameter of 6 mm, 400 μm) | ITO | Parylene (5 μm) | EPO-TEK 301 | Acoustic lens |
| [21] | PVDF (diameter of 12.9 mm, 9 μm) | ITO | - | Concave glass | Press focusing |
| [22] | PVDF (diameter of 12 mm, 9 μm) | ITO | - | Concave glass | Press focusing |
Table 3.
Performance evaluation of TUTs.
| Ref |
Center frequency (MHz) |
Fractional bandwidth (%) | SNR |
Average transparency (%) |
Lateral/Axial resolution of US |
Lateral/Axial resolution of PA |
| [7] | - | - | - | 80 | - / - | - / - |
| [9] |
14.5 14.5 | 30 | - | 80 | - / - | - / ~900 μm |
| [10] | 13 | 25 | 38 | 80 | - / - | 8.5 μm/ ~167 μm |
| [11] | 11 | 23 | - | 66 | 198 μm/224 μm | 242 μm/158 μm |
| [12] | 7.5/31.5 | 173/25 | 46.4 | 70 | 130 μm/890 μm | 2.4 μm/91 μm |
| [13] | 36.9 | 33.9 | 41.5 | 80 | - / - | - / - |
| [14] | 13 | 36 | - | 90 | - / - | 6.92 μm/202.5 μm |
| [15] | 13 | 60 | - | 80 | 230 μm/108 μm | - / - |
| [16] | 34 | 18 | - | 50 | - / - | 12.5 μm/208 μm |
| [17] | 6 | 50 | - | 80 | - / - | - / - |
| [18] |
7.8/13.2 7.2/11.8 |
28.2/66.7 36.1/62.7 |
44.8 53.7 |
80 70 | - / - |
5.1 μm/375.9 μm 7 μm/285.6 μm |
| [19] |
27.5 23.4 |
36 38 | - | 67 | - / - |
285 μm/90 μm -/- |
| [20] | 8 | 45 | - | 72 | - / - | - / - |
| [21] | 24 | 108 | 15.2 | 60 | 130 μm/32.5 μm | 4.2 μm/ - |
| [22] | 36 | 122 | 28.9 | 60 | 37.8 μm/17.7 μm | - / 39.1 μm |
IV. Conclusions
We studied an optically TUT. We discussed various aspects of these transducers: center frequency, optical transparency, and imaging results. We also delved into the range of improvement of the transducer, for example, maximizing the optical transparency and increasing the center frequency and bandwidth of the transducer. Most TUTs used LNO-based transparent piezoelectric elements. However, by optimizing the DC poling of PMN-PT, TUTs with better performance than LNO-TUTs were obtained. PVDF has the advantage that it is a flexible piezoelectric material. PVDF has been used when physical convergence was required. Most of the transparent electrodes used ITO electrodes, though some other electrodes have been explored. It is necessary to find a transparent electrode material with higher conductivity than ITO. In addition, research on the backing and matching layers necessary to improve the TUT performance. An optimal TUT can facilitate rapid clinical confirmation based on various optical images in addition to PA and US images. Such a TUT can be obtained by the integration of various imaging systems.


