
I. Introduction
II. Chamber Design
III. Measurement system
IV. Data Analysis Method
V. Results
5.1 Free chamber
5.2 Hemi-free chamber
VI. Conclusions
I. Introduction
Multipath of signal propagation often generates unwanted emphasis or suppression of signal com-ponents over the spatial location. Especially for low speed propagation such as acoustic signal, wide variation of magnitude and phase can be observed for distinct positions of source and receiver over the broadband of spectrum. The outdoor experiment can be solution for eliminating multipath problem with sacrifice of background noise and climate condition. Therefore, in acoustic experiments, controlling the reflection and noise both simultaneously is the in-dispensable requirement in order to gain the con-sistent information over the spatial, spectral, and temporal domain.
Numerous studies have been carried out to provide echo-free indoor environment since the early stage of acoustic research. Multilayer cloth separated by air spaces was utilized and analyzed to initiate the anechoic chamber [1] and wedge, pyramid, and sheet layer were compared to develop successful anechoic chamber in terms of inverse square law [2]. Koidan et al. performed extensive analysis on structure, material, and installation of wedges for National Bureau of Standards anechoic chamber [3]. The room-size anechoic chamber based on the flat-walled multilayered linings was realized by optimizing the combination of layers [4]. The study of mounting effects on the acoustic properties of the melamine wedges used in the large anechoic chamber was presented by Schneider [5]. Sun et al. investigated design of an economic anechoic chamber for acoustic experiments such as 3D audio playback through a spherical loudspeaker array [6].
The anechoic chamber is qualified by inverse square law which represents the natural spatial decreasing of carrier power over the distance. Provided that the microphone has proper isotropic property, the deviation from inverse square law proportionally corresponds to the power of indirect signal with certain degree of freedom to the spectral properties of devices. ISO 3745:2003 specifies methods for measuring the sound pressure levels on a measurement surface enveloping a noise source in anechoic and hemi-anechoic rooms in order to determine the sound power level or sound energy level produced by the noise source [7]. The annex A and B of the ISO 3745 describes the criterion of the ideal free field and hemi-free field condition for general purpose measurement and specific sound source, respectively. At the time of writing this paper, the standard is in the process of being revised to the ISO/DIS 3745 and minor modifications are specified in the annex A and B [8]. Also ISO/DIS 3745 states that the annex A will be separated for independent standard as ISO/DIS 26101 which is under development status [9].
The work presented in this paper proposes subset of conventional anechoic chamber for the affordable and maneuverable solution. Among the numerous acoustic experiments, the chamber offers the accurate environment for the Direction of Arrival (DOA) estimation based on received spectrum, phase, and magnitude. In the experiments, the signal is produced by the conventional speaker and sensed by the specially designed system for DOA estimation. Therefore, the design of the anechoic chamber should be focused on the receiver component and on the ease of the transmitter component due to the predetermined signal generator. Note that the conventional anechoic chamber handles the variety of sound sources with pre-defined microphone locations (or moving microphone) in order to evaluate the level of signal precisely. Due to the relatively predictable directivity of the generator, the designed chamber expects to be more efficient than versatile anechoic chamber in terms of the ratio between free field performance to the absorbing effort.
II. Chamber Design
The chamber designed in this paper is based on the acoustic pyramids to remove the sound reflections on the boundary of the chamber. Although, the acoustic wedge is prevalent shape for the conventional chamber, pyramid figure is employed due to the cost efficiency in volume-wise view. The pyramid occupies 33 percent less volume than the wedge body with identical structural parameters, therefore the developing cost for the chamber is decreased with certain degree of performance degradation. Beranker and Sleeper suggested that the best structure for the chamber is glass fiber wedge in terms of pressure reflection however the pyramidal shape showed the com-parable performance to the wedge [2]. The figures of pressure reflection curve demonstrated that the pyramidal structure has exponential decreasing over the frequency axis with minor ratio and frequency shift than wedge performance. Therefore, the choice of the pyramidal structure is justified by the trade-off between the expense and the performance.
The chamber performance, which is free field range in terms of frequency and distance, highly depends on the pyramidal dimension and material. The main body of the pyramid is fabricated from the open cell polyurethane foam with unknown nominal density and absorption coefficient. Unfortunately, most of the acoustic foam companies in Korea does not provide the absorption parameters based on ASTM C423 [10] standard. According to the Koidan et al [3], less density of the material generally offers the lower pressure reflection coefficient and reduced cut-off frequency for the chamber. In this pyramid design, we assumed that the density of the material is sufficiently comparable to the conventional acoustic wedges in professional grade. The dimension of the pyramid shown in Figure 1 is determined by the Beranker and Sleeper chart [2]. The taper and base length are 42 cm and 8 cm, respectively. Based on the chart, the cut-off frequency for the given dimension is near 160 Hz but the pyramid structure demonstrates inferior performance than wedge therefore around 200 Hz is expected. Also the quarter wavelength of the 200 Hz is approximately 42 cm which corresponds to the taper length of the pyramid. The base width of the pyramid is 30 cm by 30 cm which is consistent to the binding agent of the chamber frame.
|
Fig. 1. The dimension and actual picture of the acoustic pyramid. |
The frame of the chamber is constructed by the angle posts and angle beams which provide the easy installation and assembly of shelving structure. The frame of the shelving configuration binds the in-dividual pyramid in inward direction for eliminating the sound field of the inside chamber. At the edge of the chamber, the pyramid points toward outside to avoid overlapping the peaks between pyramids.
The space capacity of the chamber is required to be spacious enough for far field provision which is specified by the ISO 3745. Note that the minimum distance between the sound source and receiver is 50 cm according to the inverse square law of sound field [8]. For the proper working space, the frame of the chamber is fabricated with dimensional quantities as 2.1 m, 3 m, and 2.1 m for width, length, and height respectively. The dimension and actual picture of the chamber is presented in Figure 2. The rectangle formation of the chamber is reinforced by dividing and combining the structure in lengthwise in order to support the numerous pyramids. Also, the chamber entrance is created at facade of the rectangle by utilizing the multiple hinges over the edge and the door is sealed with compression via the full-size latches.
|
Fig. 2. The dimension and actual picture of the chamber. |
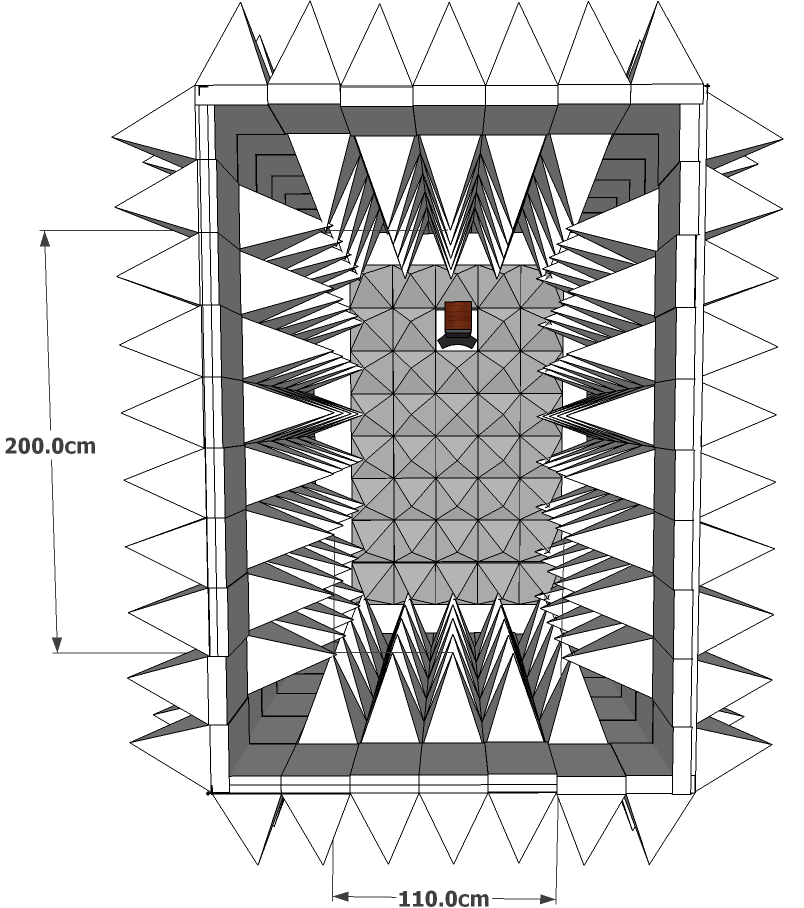
Upon the near wall location for sound source, the chamber achieves roughly 1.1 m2 free field region for the receiver. The problem of low interior height can be handled by removing the pyramids on the floor for the instrumental setup and repositioning the pyramids back to the floor for the actual experiment. Also observe that, without the pyramids on the ground, the arrangement is for the hemi anechoic chamber experi-ments. The single layer of the pyramids for the chamber exterior is vulnerable to the intense level of noise outside however the chamber is situated in the tranquil laboratory room in order to minimize the ambient noise level for the experiments.
III. Measurement system
The hardware measurement system consists of microphone, speaker, audio device, and computer which are configured as Figure 3. The speaker (M- Audio; BX5a) is the active studio monitor speaker with 5" low frequency driver and 1" high frequency driver. The speaker can generate up to 70 watt power over the range from 56 Hz to 22 kHz and is connected by the balanced XLR cable. The microphone (Behringer; ECM8000) is condenser microphone for measure-ment with flat frequency response and omnidirec-tional pattern. The microphone works with phantom power and is connected by balanced XLR cable. The audio device (Cakewalk; Sonar V-Studio 100) is multi input and output audio device which can handle up to 8 inputs / 6 outputs with 24 bits / 96 kHz sampling quality. The device is connected by USB and driven via ASIO 2.0 driver. The computer software for mixing and capturing is Sonar VS from cakewalk.
|
Fig. 3. Block diagram of measurement system. |
The speaker is located at the one end of the chamber. The stand for the speaker is 77 cm height metal platform with spikes on the base for firm grip over the floor. Between the speaker and stand, monitor isolation pad from Auralex is positioned in order to decouple the speaker from the chamber and floor. The level of the active speaker is fixed as medium level and passive volume controller (SM Pro Audio; Nano Patch) is connected in cascade over the XLR cable for volume control nearby the computer.
IV. Data Analysis Method
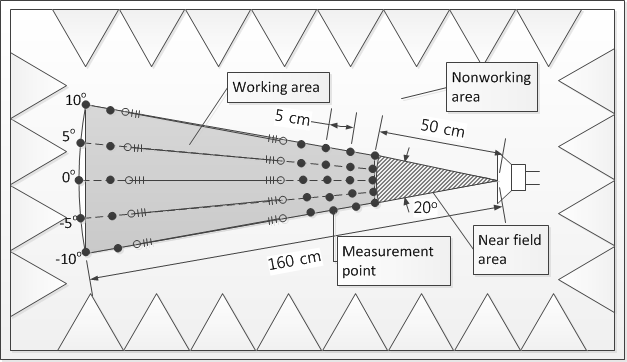
The annex A of ISO 3745 is partitioned into four sessions as sound source, device installation, test procedures, and qualification procedure. The sound source session is excluded from this measurement since the session describes the sound source directivity which is eliminated from our compliance list. Note that the designed chamber provides the free field for receiver based on the conventional speaker. The device installation session explains the arrangement of the sound source and receiver for proper measure-ment of the sound field. In the session, the micro-phone traverses shall be made along at least five straight paths away from the measurement sphere or hemisphere in different direction. The microphone operation grid in this experiment is coordinated for five straight lines from the speaker for 0°, +5°, +10°, -5°, -10° angles. Observe that the axis perpendicular to the speaker face is zero degree and clockwise rotation increases the angle degree. In addition, four lines are allocated for non-working area as left- upper, left-lower, right-upper, and right-lower corner from the speaker center toward the corresponding corner edge. The left and right side are associated with the positive and negative angle respectively. The identical two measurement campaigns were con-ducted for free field performance over free and hemi-free chamber which are easily interchangeable by simple labor.
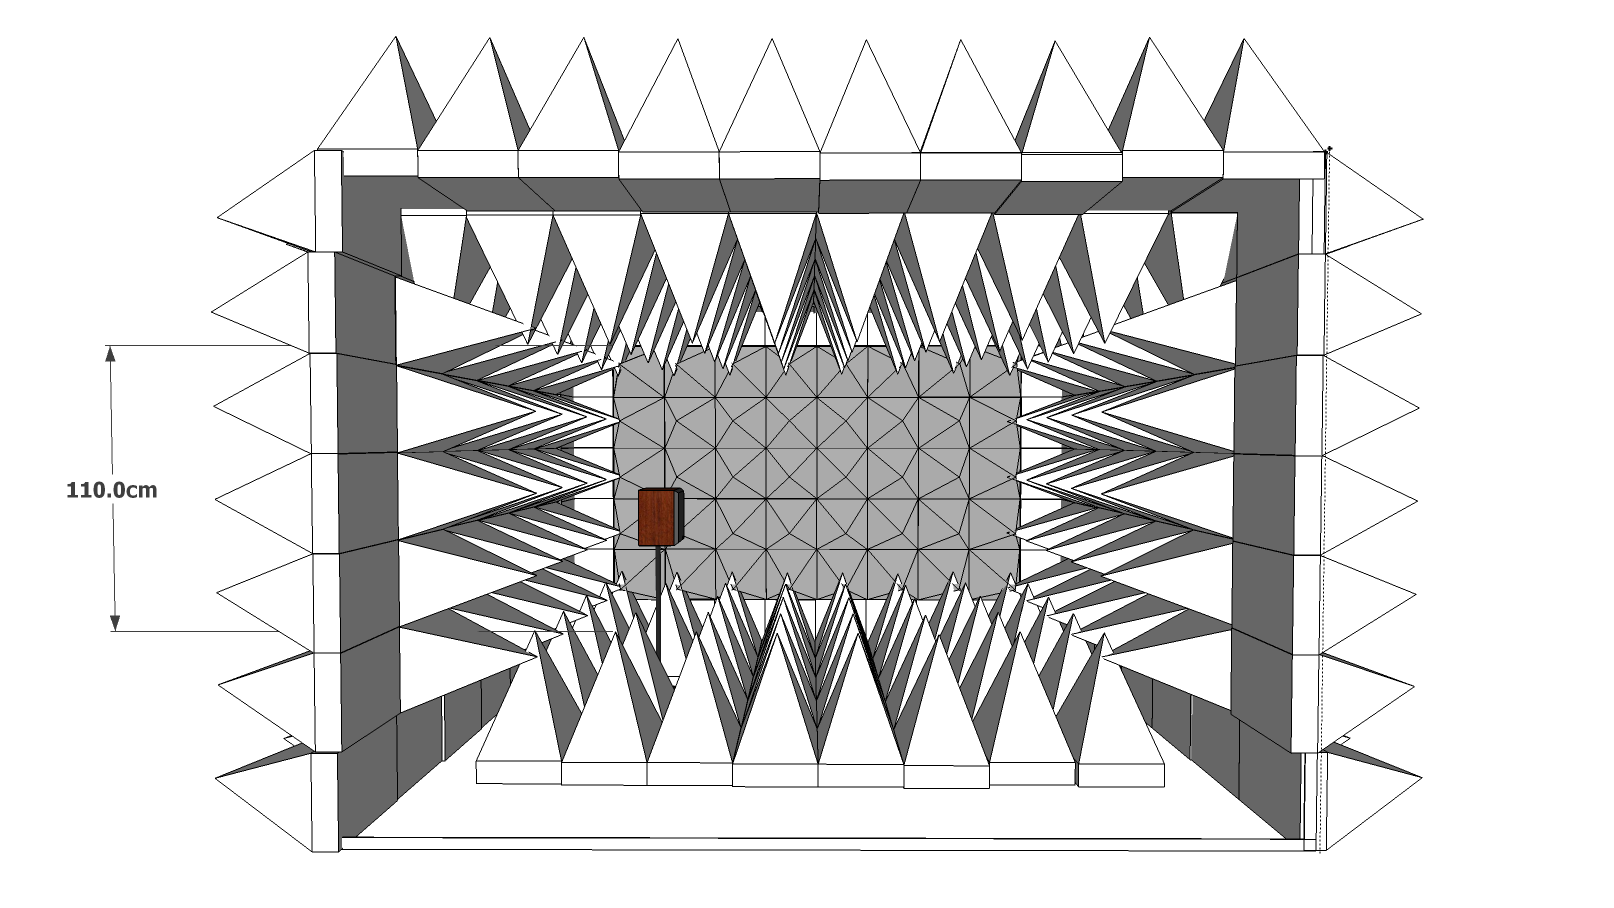
The test procedure session shows actual execution of experiment which includes speaker signal, micro-phone distance, and mathematical model. The signal operated from the speaker is the one-third octave band signal in sequential steps that cover the entire frequency range over the chamber qualification. In the experiment, eleven one-third octave band signals are created from the white noise with designated filters according to the ANSI S1.11-2004 [11]. The center frequencies are listed as 250 Hz, 500 Hz, 1 kHz, 2 kHz, 4 kHz, 5 kHz, 6.3 kHz, 8 kHz, 10 kHz, 12.5 kHz, and 16 kHz. The microphone moves along the paths for each test signal starting 50 cm away from the speaker and ending at the chamber wall with the spacing in less than 10 cm apart. In the designed chamber, the microphone traverses the five straight paths with precise 5 cm distance for working area and four paths with approximately 10 cm gap for non- working area. For non-working area, the microphone is mounted on the tripod boom stand which has double axes for range extension therefore accurate position is barely sustained for sound recording. The overall experiment deployment and chamber config-uration is illustrated at Figure 4 as below.
|
Fig. 4. Deployment and configuration for the free field experiment (top-view perspective). |
The mathematical model from the test session is based on the inverse square law which describes the relationship between surface area of sphere and radius. In the free field condition, the inverse square law properly predicts the sound pressure level for the particular distance and the mathematical model is given as below
![]() (1)
(1)
where Lp (ri) is the sound pressure level in decibel at the distance ri. The a and r0 are model parameters for amplitude and distance correspondingly. From the collected data about sound pressure level and distance, the ISO 3745 offers the solution to acquire the model parameters in closed form. Also, the solution can be translated into the linear algebra style in order to utilize the mathematical program easily via linearization. The above equation is modified into linear equation as follow.
![]() (2)
(2)
For the N performed experimental data, the equation is organized as
 (3)
(3)
The solution for vector C can be written as below
![]() (4)
(4)
where superscript T denotes matrix transposition and superscript -1 indicates matrix inversion. From the C vector, straightforward computation derives the model parameters which are precisely equivalent to the solution of ISO 3745. Following the parametric estimation process, the acquired a and r0 place into the Eq. (1) and find ![]() for estimated sound pressure level for distance ri. The deviation from inverse square law at all measurement positions are determined by the following equation.
for estimated sound pressure level for distance ri. The deviation from inverse square law at all measurement positions are determined by the following equation.
![]() (5)
(5)
The qualification procedure which is the last session of the annex presents the maximum allowable deviation of measured sound pressure from theoretical levels using the inverse square law as Table 1.
The measurement surface is suitable for represen-ting the desired free field according to the ISO 3745 if the measurement surface lies outside the near field and within the allowable deviation for the given frequency band. Since the nominal mid-band fre-quencies of one-third octave bands is not range from 100 Hz to 10 kHz, the measurements taken in the chamber will not be in full conformance with the International Standard. However, the designed chamber is qualified in conformance with the ISO 3745 over the frequency range from 250 Hz to 16 kHz. Note that the taper length of the acoustic pyramid is designed to be 42 cm for cut-off frequency 200 Hz around.
V. Results
The bandpass signal from white noise is produced by the Matlab program and encoded as wave file in 16 bit resolution and 44.1 kHz sampling. Each one- third octave band signal is discharged continuously in sequential manner with 5 seconds audio and 1 second pause from 250 Hz up to 16 kHz. The level of microphone and speaker is established at the initial stage of experiment in order to provide the consistent high SNR audio without clipping sound. Note that the recording is synchronized with audio transmission.
5.1 Free chamber
Over the working area, the selected plots for the measured sound pressure and inverse square law are illustrated in Figure 5. The graph shows the results for the two low and two high frequency bands of spatial information over the perpendicular axis to the speaker face. The parameters of inverse square law are derived from the measured data and applied for representing the model values as star shape in the figure. Provided that the model represents the optimal similarity for measured data, the relative difference between the measured and model data presents the decision criterion for free field performance as shown in Table 1. For the lower frequency, the elevated deviation is observed as 0.942 dB and 0.338 dB for worst in 250 Hz and 500 Hz result respectively. The higher frequency shows the approximately the 0.1 dB maximum deviation which stands for good free field performance over the entire distance. No value above the 1.5 dB for the given frequency data is existed therefore the requirement of free field are fulfilled by the experiments.
|
Fig. 5. Sound pressure level and inverse square model distribution for selected one-third octave band signal over the angle 0° and working area of free field chamber. |
Instead of using the individual plots, the spatial contour plots as shown in Figure 6 are employed for five paths and given frequency. The contour plot presents the 0.4 m2 area, which is the active working area, out of the 2.2 m2 of entire chamber region. The gray representation of the contour plot indicates the absolute deviation in decibel which depends on the hue component.
|
|
Fig. 6.The contour plots of absolute deviation in decibel based on one-third octave band signal over the working area of free field chamber. |
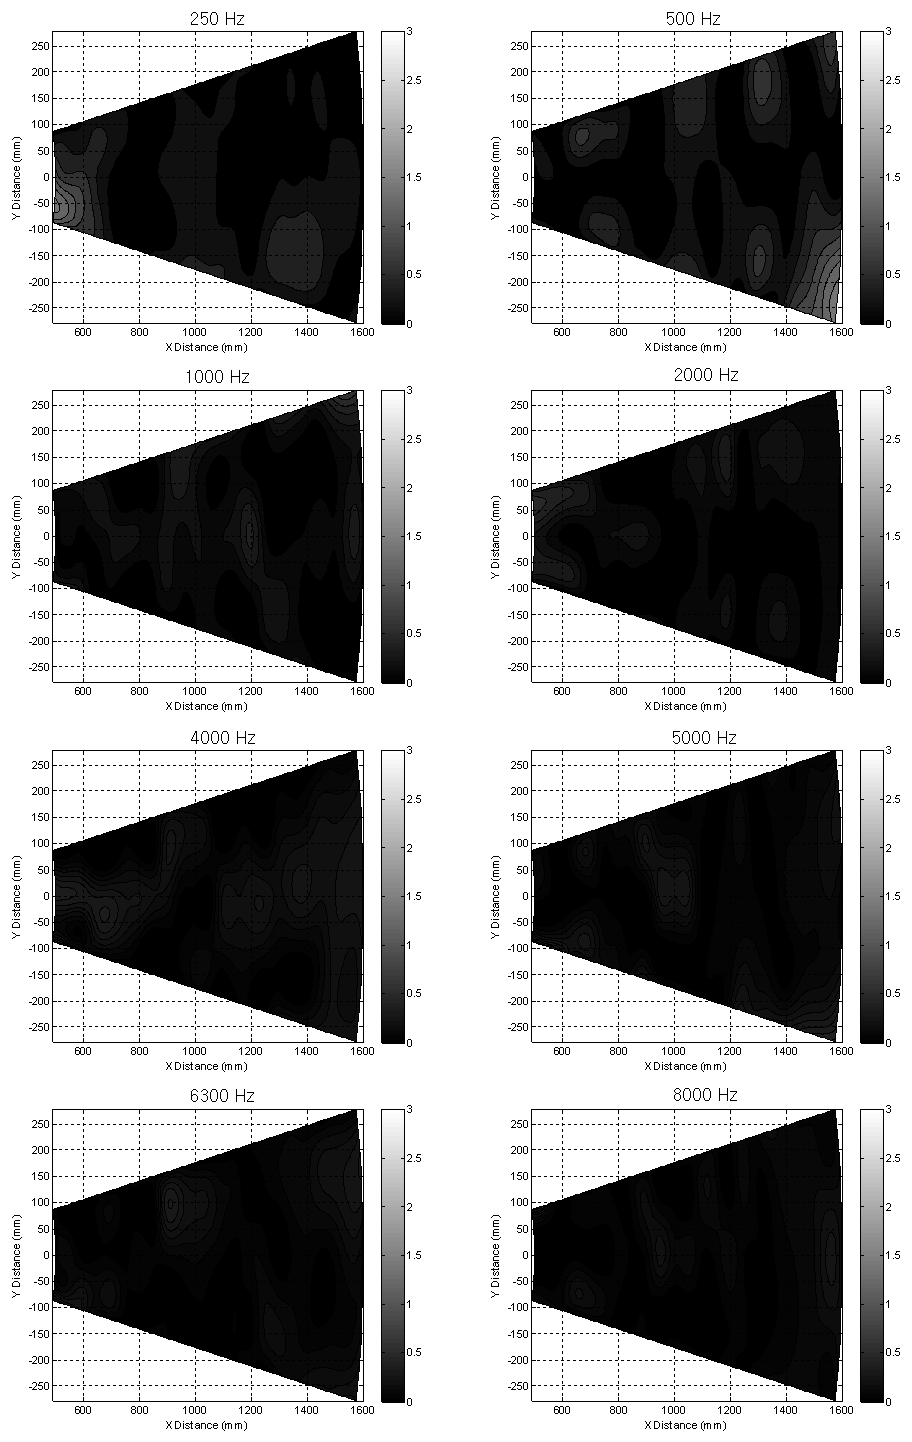
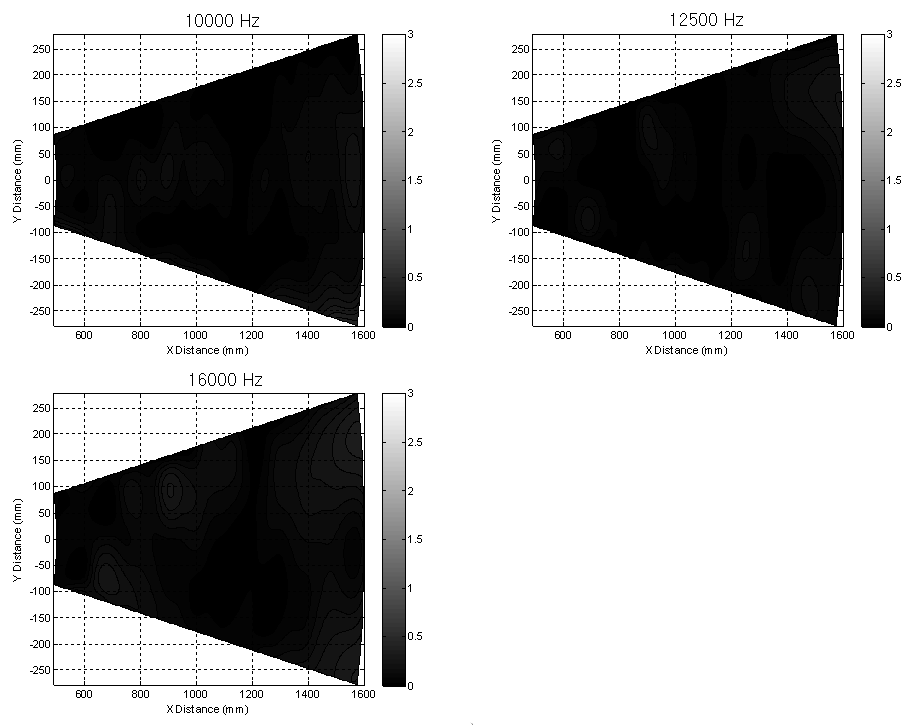
Overall, the results of contour plots indicate that the measured data accurately match with inverse square law model. Only the two low frequencies as 250 Hz and 500 Hz present the noticeable discrepancies in right side (negative angle) of chamber south (speaker side) and north (receiver side), respectively. However, the maximum deviations of both low frequencies are still below the 1.5 dB which is allowable upper limit for the given frequencies. Table 2 summarizes the absolute value of the maximum deviation for the individual direction and frequency. No value in the table is above the upper limits therefore the free chamber is in conformance with free field performance defined by ISO 3745 for 250 Hz - 16 kHz one-third octave band signal. The table shows that the deviation located at negative angle and lower frequency pre-sent higher numerical quantities than the values at the other angle and higher frequencies in general.
In non-working area, the microphone measured the sound pressure level for each direction with 10 positions which is approximately 10 cm apart. The direction is specified as the path between the center of speaker (low frequency driver) to the corners as NL (Negative Lower), NU (Negative Upper), PL (Positive Lower), and PU (Positive Upper). Table 3 organizes the absolute value of the maximum deviation for the each corner and frequency. There is no obvious tendency of correlation in corner directions but the table presents the pronounced deviation values at the high and low frequencies. Consequently, the corner of the free chamber provides inferior performance due to the significant power of the indirect signal from the structural drawback of concave shape.
5.2 Hemi-free chamber
The hemi-free field is established by withdrawing the entire acoustic pyramids from the chamber floor. Table 4 organizes the absolute value of the maximum deviation for the individual direction and frequency. Certain values in the table are above the upper limits and the eminent quantities are displayed with underline for readability. Consequently, the hemi-free chamber does not comply with the requirement of hemi-free field performance specified by ISO 3745.
Instead of full compliance, the hemi-free chamber is in conformance with hemi-free field performance for partial frequency band as 1 kHz - 16 kHz one- third octave band signal. Note that the distance limited compliance cannot be specified due to the widespread deviation of 500 Hz result. Also the elimination of two low frequency bands is justified by accumulation of sound field shown in lower frequency overall in the Table 4.
For non-working area, Table 5 consolidates the absolute value of the maximum deviation for the each corner and frequency. In the low frequency band, the lower corners produce the higher deviation than the outcome of the upper corners because of the short distance between the receiver and hard surface which creates strong reflection of the sound. On the other hand, the high frequency band presents no apparent bias of corner direction but the overall the deviation is outstanding. Therefore, the corner of the hemi-free chamber serves substandard performance due to the disadvantage of corner and hard surface of floor.
VI. Conclusions
This paper presents the design and analysis of the free and hemi-free anechoic chamber for sound localization and performance evaluation of the chamber based on the ISO 3745. Contrary to the conventional anechoic chamber which realizes the free field for the isotropic sound source, the devised chamber from this paper achieves the free field environment for the receiver based on the conventional speaker. The chamber is the subset of conventional anechoic chamber for the affordable and maneuverable solution. The free field performance is evaluated by the ISO 3745 which explores the deviation between the measured sound pressure level and model value from inverse square law over the one-third octave band signals.
The performance evaluation based on the ISO 3745 denotes that the chamber is in conformance with free field performance for 250 Hz - 16 kHz one-third octave band signal. Also the chamber complies with the hemi-free field for 1 kHz - 16 kHz one-third octave band signal due to the significant deviation between the measured and model at the 500 Hz one-third octave band signal.
The anechoic chamber described in this paper present affordable and maneuverable solution for the free and hemi-free field over the conventional range of audible sound. Future work will involve perform-ing the researches on the design of small aperture sound localizer and the designed chamber offers the excellent free and hemi-free field condition to the device under test over the dedicated range of acoustic frequency. Furthermore, the complicated situation of acoustic experiments will be exercised by recording the sound on the real field and playing over the speaker at the anechoic chamber which provides the realistic sound with free field.
