Review Article

The Journal of the Acoustical Society of Korea. 31 January 2026. 41-54
https://doi.org/10.7776/ASK.2026.45.1.041

ABSTRACT


MAIN

  • I. 서 론

  • II. 연구 방법

  •   2.1 주제범위 문헌고찰

  •   2.2 문헌 검색 및 선정

  • III. 연구 결과

  •   3.1 감각지표 활용 방식에 따른 유형

  •   3.2 감각지표 구성 요소의 유형 분류

  •   3.3 감각지표 연구 설계 및 분석 방법

  • IV. 결 론

  • 부 록

I. 서 론

기존의 음환경에 관한 연구와 소음 관리 정책은 주로 환경 소음이 생활환경과 건강에 미치는 부정적인 영향을 최소화하는 것을 중심으로 발전해 왔다. 이에 따라 음환경 평가를 위해 등가소음도와 같은 물리적 음압 레벨 기반의 단일 수치 지표를 주로 사용하였으며, 이는 객관성과 공간 간 비교가 용이하고 정책적·제도적 기준 설정에 적합하다는 장점을 가지고 있다.[1,2]

그러나 이러한 물리적 지표 중심의 접근 방식은 음압 레벨 수준을 단일 값으로만 제공함으로써, 해당 소리가 어떤 음원으로 구성되어 있으며, 맥락적 요인에 따라 사람들이 어떻게 다르게 인식하는지 충분히 설명하지 못한다. 예를 들어, 동일한 음압 레벨이라도 음원의 종류, 시간·공간적 맥락, 이용 목적, 경험 등에 따라 음환경 쾌적도 또는 불쾌감 등이 다르게 인지될 수 있음에도 불구하고[3,4] 기존 음환경 접근 방식은 일정 임계 레벨을 초과하는 모든 소리를 ‘소음’으로 간주한다는 한계를 가진다.[5]

이러한 한계를 극복하기 위하여, 최근 음환경 연구에서는 소리를 단순한 물리적 자극이 아닌 인간의 지각, 정서적 경험, 행동, 생리 반응에 복합적으로 작용하는 요인으로써 이해하는 방향으로 진행되고 있다.[6,7] 특히 사운드스케이프 개념이 도입된 이후, 음환경에 대한 접근 방식은 전통적인 음압 레벨 중심의 연구에서 벗어나 심리음향 지표, 음원 구성 지표 등과 같은 다양한 지표를 함께 고려하는 방식으로 나아가고 있다.[8] 이러한 연구들은 동일한 물리적 환경에서도 개인의 경험과 기대, 활동, 시간대, 이용 목적 등에 따라 음환경에 대한 인식이 각각 다르게 나타기에 더 이상 음환경을 단순히 ‘부정적 영향의 소음’이 아닌 ‘인지 음환경’으로 인식해야 할 필요성을 점차 강조된다.

이러한 배경에서 지각·정서 반응 및 생리적 반응을 정량적으로 설명하거나 예측하기 위하여 감각지표 기반 연구가 증가하는 추세를 보이고 있다. 기존 연구들은 소음 성가심, 음환경 품질, 쾌적도, 불쾌감, 만족도 등과 같은 주관적 반응을 물리적 지표, 심리음향지표, 설문 기반 평가와 결합하여 지표화하거나, 설명 또는 예측하기 위한 다양한 통계 모델을 제안하고 있다. 그러나 이러한 연구들은 대부분 개별 지표의 적용이나 특정 공간 유형이나 사례에 초점을 둔 경우가 많아서 감각지표의 구성, 활용 방식, 검증 방법을 전체적으로 비교 및 분석하는 데에는 제한적이다. 특히 감각지표가 단순히 지표로 활용되는지, 예측식 또는 알고리즘으로 활용되는지, 어떤 연구 설계와 분석 방법이 자주 이용되는지에 대한 체계적인 정리가 되지 않은 경우가 많다. 이로 인하여 음환경 감각지표 연구에 관한 전반적인 흐름과 연구 공백을 체계적으로 파악하는 데 어려움이 존재한다.

따라서 본 연구에서는 음환경 연구에서 제안된 감각지표에 관한 선행 연구를 체계적으로 검토하여 감각지표의 유형, 구성 및 검증 방식의 구조적 특성을 정리하고자 한다. 이를 바탕으로 감각지표 연구의 주요 흐름과 한계를 고찰하고, 향후 음환경 지표 개발 및 예측 모델링 연구를 위한 연구 방향을 제시하고자 한다. 이를 위하여 다음과 같은 연구 질문을 설정하였다.

(1) 음환경 연구에서 감각지표는 어떠한 방식으로 활용되고 있으며, 이를 유형별로 어떻게 분류할 수 있는가?

(2) 감각지표는 어떠한 음향 및 비음향적 구성 요소를 포함하고 있으며, 어떤 유형의 지표 체계로 분류될 수 있는가?

(3) 감각지표는 어떠한 연구설계, 자료 유형, 분석 방법을 통해 검증되었는가?

II. 연구 방법

2.1 주제범위 문헌고찰

주제범위 문헌고찰은 특정 주제에 대해 기존 연구의 전반적인 동향, 연구 범위, 방법론적 특성 및 개념적 구조가 무엇인지 체계적으로 탐색하기 위한 문헌 분석 방법이다. 해당 방법론은 연구 분야에 대한 핵심 개념, 연구 유형, 주요 자료 및 근거들을 매핑하고, 연구가 주로 진행된 영역과 상대적으로 불충분한 영역이나 연구 공백을 신속하게 파악할 수 있다는 장점이 존재한다.

유사한 분석 방법인 체계적 문헌고찰은 명확한 연구 질문에 통하여 객관적이고 재현성이 있는 방법을 통하여 연구들을 수집하여 결과를 고찰하고, 메타분석의 경우에는 서로 다른 여러 연구의 추정치를 통계적 방법을 활용하여 정량적으로 통합하거나 효과 크기를 추정한다. 반면에 주제범위 문헌 고찰은 연구 주제의 전반적인 이해를 폭넓고 탐색적으로 분석하는 데 목적을 둔다는 점에서 차별성을 가지고 있다.[9,10,11]

국내에서도 주제범위 문헌 고찰은 인문학, 사회과학 분야뿐만 아니라 의약학, 공학, 예술체육 등의 다양한 학문 분야에서도 폭넓게 수행되고 있다.[12,13,14] 이러한 연구는 주로 해당 분야의 연구 동향을 분석하고 개념적 틀을 정리하거나 선행 연구의 한계와 향후 연구 방향을 도출하는 것을 목적으로 수행된다. 이는 연구 분야의 구조적 특성을 파악하고 연구 주제를 체계적으로 정리하는 데 효과적인 방법으로 평가된다.

본 연구는 Arksey와 O’Malley[15]가 제안하는 주제범위 문헌고찰의 5단계 절차를 기반으로 연구를 수행하였다. 해당 절차는 (1) 연구 질문 설정, (2) 관련 연구 검토, (3) 문헌 선정, (4) 자료 추출 및 입력, (5) 연구 결과 요약 및 해석으로 구성된다.

1단계는 연구 질문 설정으로 연구 목적과 범위를 명확하게 정의하여 문헌 검색 과정에서 문헌의 누락을 최소화하고 연구 주제에 대한 광범위한 이해를 확보한다. 2단계 관련 연구 검토에서는 온라인 데이터베이스 검색, 웹사이트, 주요 저널 참고문헌 등을 활용하여 수기로 관련 연구를 수집하였다. 3단계는 문헌 선정 과정으로 연구의 목적과 범위에 따라 문헌의 포함 및 제외 기준을 결정한다. 이를 바탕으로 최소 2명 이상의 연구자가 각각 독립적으로 검토를 진행한다. 만약 연구자 간의 의견이 일치하지 않을 경우 논의를 통하여 최종적으로 문헌을 선정한다. 4단계는 자료 추출 및 입력으로 문헌의 제목, 저자, 출판 연도, 연구 목적, 연구 방법론, 활용된 지표 및 분석 등을 표준화된 형식에 따라 정리한다. 마지막으로 5단계에서는 연구 질문과 목적을 중심으로 수집된 연구 결과를 종합하고 연구 특성과 한계점, 향후 연구 방향성에 관하여 다수 연구자가 공동으로 해석 및 논의를 진행한다.[16,17]

2.2 문헌 검색 및 선정

본 연구는 Preferred Reporting Items for Scoping Reviews(PRISMA-ScR) 가이드라인을 준수하여 수행하였으며, 2000년부터 2025년까지 Scopus 데이터베이스에서 제목, 초록, 키워드를 활용하여 출판된 영문논문을 대상으로 검색하였다. ‘음환경’과 ‘사운드스케이프’에 관한 연구는 공학 뿐만 아니라, 의학 및 보건, 해양 생태학, 예술 등 다양한 주제 분양에서 나타났다. 따라서 연구 목적과 범위에 맞는 명확한 문헌을 선정하기 위하여 다음과 같은 포함 기준을 설정하였다. (1) 음환경에 관한 연구(“soundscape”, “acoustic environment”, “sound environment”), (2) 물리적 및 심리적 지표를 활용한 연구(“psychoacoustic parameter”, “acoustic measure” 등), (3) 인지 및 지각에 관한 연구(“perception”, “annoyance”, “pleasantness” 등), (4) 모델링, 예측, 지표에 관한 연구(“modelling”, “prediction”, “indicator” 등)에 따른 검색연산으로 문헌을 검색하였다. 문헌을 식별하는 과정은 세 명의 연구자가 각 문헌에 관하여 독립적으로 ‘포함’, ‘보류’, ‘제외’로 분류하고 검토하여 선정하였다. 해당 연구 주제는 유럽 등 선진국에서 주도적으로 다뤄지고 있어, 영어로 출판된 문헌을 중심으로 분석하였다. 또한 충분한 연구 데이터의 신뢰성을 확보하기 위해 학회 초록은 포함 대상에서 제외하였다.

이를 통하여 Fig. 1과 같이 논문 데이터 베이스 검색을 통해 210편의 문헌이 식별되었으며, 그 중 중복 문헌 3편을 제거한 후 207편 문헌의 제목과 초록을 검토하였다. 초록 검토 단계에서 음환경 또는 사운드스케이프와 관련성이 낮은 연구(27편)와 인간 대상 연구가 아닌 연구(18편)를 중심으로 45편의 문헌을 제외하고 총 162편의 문헌을 추출하였다.

https://cdn.apub.kr/journalsite/sites/ask/2026-045-01/N0660450105/images/ASK_45_01_05_F1.jpg
Fig. 1.

(Color available online) Flow diagram of database search and study selection process.

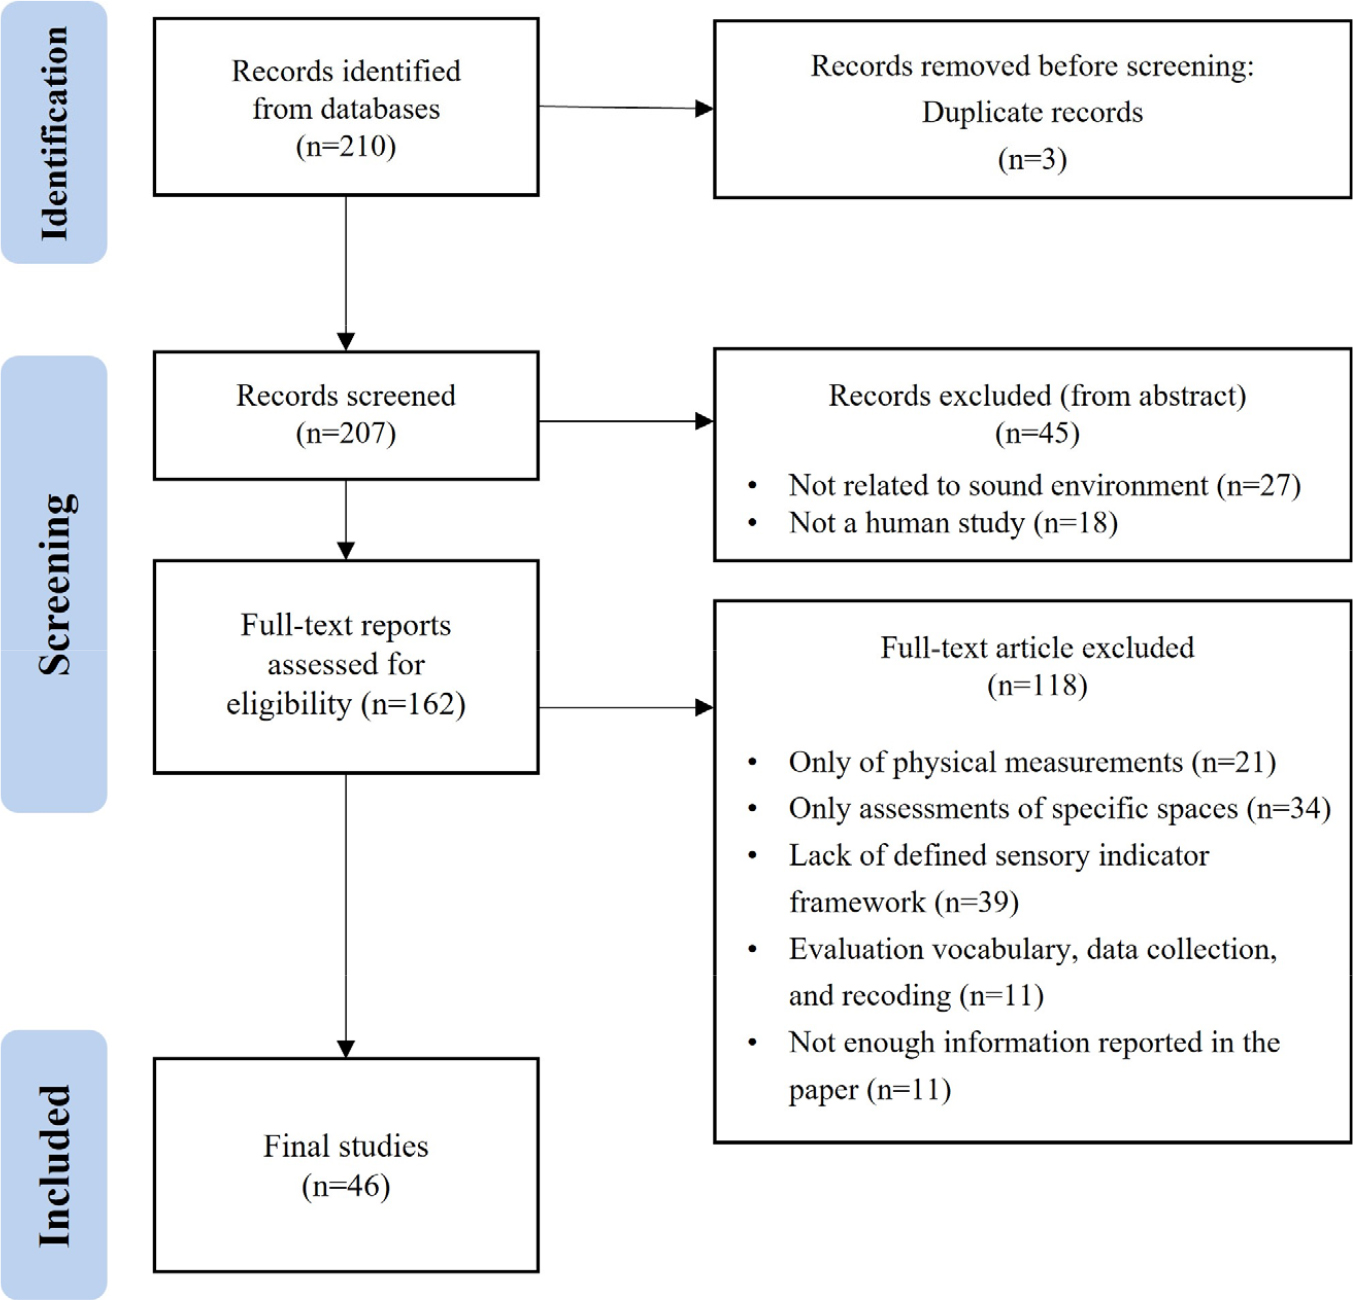
전문 검토는 162편의 문헌 본문을 대상으로 수행하였으며, 이 과정에서 총 118편의 문헌을 제외하였다. 제외된 문헌은 물리적 음향 측정 및 분석만 진행된 연구(21편), 특정 공간 또는 단일 사례에 국한된 평가 연구(34편), 감각 평가 지표 체계가 제시되지 않은 연구(39편), 평가 어휘 개발·데이터 수집·기록 방법론에 한정된 연구(11편), 그리고 충분한 정보가 보고되지 않은 연구(11편)로 분류하였다. 최종적으로 연구 목적과 범위에 부합하는 46편의 문헌을 분석하였다.

III. 연구 결과

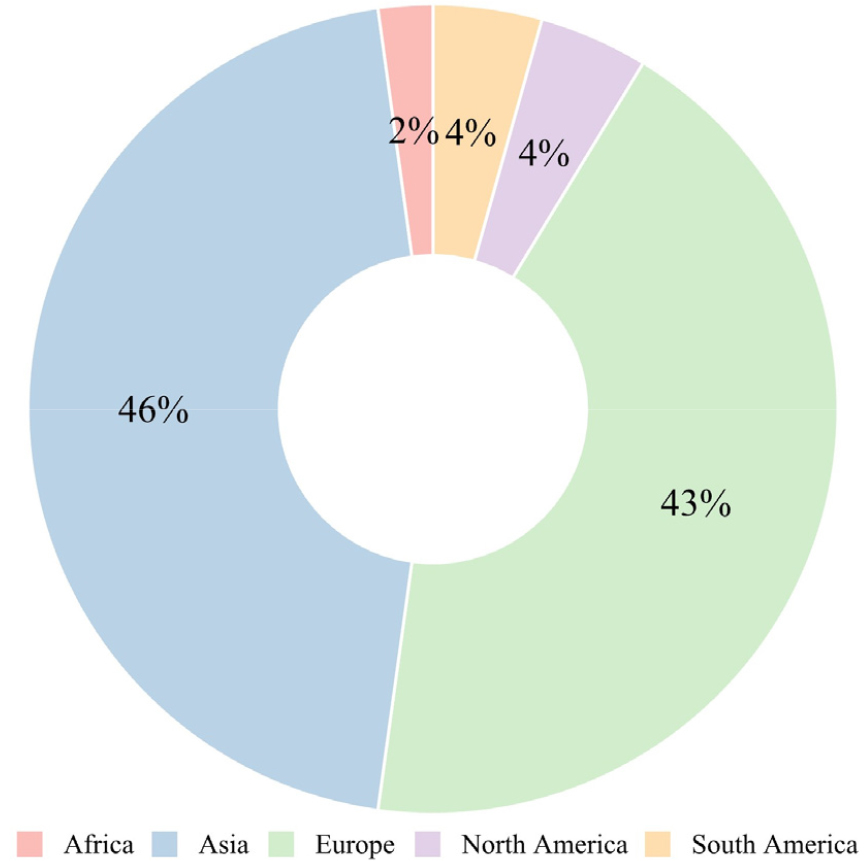
최종적으로 선정한 46편의 문헌을 바탕으로 연구 목적에 따라 음환경 감각지표 관한 연구 데이터를 수집하였다. 2000년부터 2025년까지 문헌 검색을 통하여 최종적으로 추출된 문헌 중 최근 5년간(2021~2025) 발행된 문헌은 27편으로 58.7 %를 차치하였다. 대부분의 연구는 Fig. 2과 같이 유럽(43 %)과 아시아(46 %)에서 주로 수행되었으며, 북미, 남미 등 기타 국가 사례는 일부에 불과하였다. 선정된 문헌들의 분석을 통해 다음과 같은 세 가지 측면의 결과를 도출하였다. (1) 어떠한 활용 목적과 분석 방식으로 사용되었는지에 따른 활용 유형, (2) 감각지표의 구성하는 음향 및 비음향 구성 요소에 따른 분류, (3) 감각지표의 연구설계 및 분석 특징이다. 각각의 결과는 Table A1를 바탕으로 연구 결과 요약 및 해석을 실시하였다.

https://cdn.apub.kr/journalsite/sites/ask/2026-045-01/N0660450105/images/ASK_45_01_05_F2.jpg
Fig. 2.

(Color available online) Geographic distribution of the reviewed sound environment studies.

3.1 감각지표 활용 방식에 따른 유형

음환경 분야에서 감각지표는 활용 방식에 따라 Table 1과 같이 세 가지 유형으로 분류된다. 첫째, 감각지표 자체를 개발하고 활용하는 유형으로 음환경 인식에 영향을 미치는 요인을 정량화하여 분석하고 지표화하는 것을 목적을 둔다. Chen et al.[18]는 도시림에서 음환경 품질을 평가하기 위해 쾌적성, 활력감, 조화도 등과 같은 감각 기반 지표와 다양한 경관 특성 및 시각적 요인을 통합적으로 고려하였다. 연구에서 활용된 Sound Harmonious Degree(SHD)는 음원 지배력과 선호도를 결합한 지표로 지각적 특성을 정량화하고, 공간적·시간적 맥락에 따른 음환경 품질을 비교·평가할 수 있는 지표를 제시한다. 또 다른 연구에서도 LAeq, N10, 생태학적 지수 등과 같은 물리적, 환경적 지표를 활용하여 음환경 쾌적도와 성가심을 나타낼 수 있는 지수를 구성하고 이를 설문과 실험을 통하여 검증하는데 초점을 두고 있다.[19,20,21]

Table 1.

Type of sensory indicator usage in acoustic environment studies.

Type Description Typical outputs
Indicators[18,19,20,21,25] ∙Aim to represent the perceptual qualities of the sound environment
∙Focus on quantifying subjective experience into measurable indicators
Soundscape quality index, tranquility index, harmony/pleasantness score
Predictive equations / models[22,23] ∙Aim to predict subjective responses such as annoyance, comfort, or satisfaction
∙To combine with contextual factors and personal variables
Predictive equations, probability models, regression coefficients
Algorithm-based models[24,26,27,28] ∙Capture nonlinear and complex relationships between indicators and responses
∙Oriented toward classification or continuous prediction tasks
Classification accuracy, prediction performance, feature importance

둘째, 이미 개발 및 제안된 감각지표를 예측하는 모델을 제안하는 유형으로, 여러 지표를 결합하여 예측식을 도출하고 이를 통해 인간의 정서적 반응을 정량적으로 예측하고자 한다. 기존 연구에서 자주 활용되는 Lden, Leq뿐만 아니라 시각적 비율, 소음 민감도 등과 같은 맥락적 요인을 포함하는 복합적 모형을 도출한다. Pasanen et al.[22]은 주거지역의 도로교통소음 노출수준과 개인적 요인을 함께 고려한 로지스틱 회귀모델을 구축하여 주민들의 소음 성가심 발생 확률을 예측하였다. 이와 유사하게 Yan et al.[23]은 도시 공공 공간의 정온함을 예측하기 위해 시청각 지표를 활용하여 다중회귀모형을 개발하였다. 이러한 연구들은 개별 인자 및 인자 간 상호작용이 정서적 반응에 미치는 영향을 정량적으로 파악하고, 이를 설명하거나 예측하는 데 중점을 둔다.

세 번째는 머신러닝 및 딥러닝 기반 모델 유형으로 다양한 음향 특징을 활용하여 주관적 반응을 분류하거나 예측하는 방식이다. Lin et al.[24] 연구는 XGBoot 알고리즘을 활용하여 음환경을 예측하는 기계 학습 모델을 개발하였으며, 시각적, 청각적, 열적 환경 특성을 통합하여 음환경 품질을 예측한다. 이와 같은 알고리즘 기반 모델은 다차원 데이터를 동시에 분석할 수 있고 변수 간의 비선형적 관계를 효과적으로 파악할 수 있으나 모델의 안정성을 위해서는 대규모 데이터세트와 충분한 표본이 필요하다는 한계가 존재한다.

3.2 감각지표 구성 요소의 유형 분류

감각지표를 구성하는 음향적 및 비음향적 요인의 유형에 따라 분류할 수 있으며, 그 중 기존 연구에서 주로 활용된 변수를 중심으로 Table 2와 같이 지표 체계를 정리하였다. 첫 번째로 LAeq, Lmax, Lmin 등과 같은 물리적 음압레벨과 라우드니스(Loudness), 샤프니스(Sharpness) 등 사람의 청각적 감각특성을 반영한 심리음향 지표를 포함한다. 기존 연구들은 대부분 이를 기준 소음지표로 활용하였으며,[21,29,30,31,32,33] 감각지표 연구에서도 기본적인 변수로서 많이 활용된다.[34,35] 둘째는 음원 구성에 관한 지표이다. 이는 특정 환경에서 구성된 음원의 종류와 구성비를 정량화한 것으로 교통소음, 사람소리, 자연소리 등의 음원별 구성 비율 또는 지배적인 소음원 종류를 지표한 것이다. 이는 여러 감각지표 연구에서 음원 구성 또는 특정 음원의 유무 등을 변수로 사용하였다.[20,36,37]셋째로 생태학적 및 다양성 지표를 활용하였다.[18,19,38] 이는 도시 공원이나 산림 환경에서 생물학적 다양성을 나타내는 지표를 도입하여 쾌적성을 평가하였다. 넷째로 시청각 통합 지표를 활용한 연구로서 자연환경(녹지, 하늘 등) 비율과 밝기와 같은 시각적 환경 정보를 함께 고려하여 평온함과 같은 감각 지표에 미치는 영향을 분석하였다.[39,40,41] 마지막은 개인 특성 및 생리적 반응을 활용한 연구로 객관적인 환경정보 이외에도 개인차나 생리반응 데이터(심박, 뇌파 등) 을 지표의 한 구성요소로서 활용한다.[42,43,44,45]

Table 2.

Classification of sensory indicator components used in acoustic environment research.

Category Sub-categories Typical indicators
Physical & psychoacoustic indicators[21,29,34,35,46] Sound pressure level;
psychoacoustic parameters
LAeq, L10, L50, L90, LCeq, LC–LA;
Loudness, Sharpness, Roughness, Fluctuation strength
Sound source composition indicators[20,36,37] Proportion of sound source types;
source dominance
Traffic, human, natural, mechanical sound ratios;
presence/dominance of birds, water, music
Ecological & biodiversity indicators[18,19,38] Soundscape ecology indices NDSI, ADI, AEI, Bioacoustic Index
Audio-visual integrated indicators[39,40,41] Visual environment metrics;
interaction terms
Green view index, sky ratio, luminance, visual–acoustic interaction terms
Personal & physiological indicators[42,43,44,45] Individual attributes;
physiological responses
Noise sensitivity, personality traits, demographics; heart rate, HRV, EEG features

3.3 감각지표 연구 설계 및 분석 방법

다양한 연구 설계와 분석 방법을 통하여 감각지표에 관하여 연구가 수행되었으며, 주요 특징을 Table 3과 같이 정리하였다. 연구는 크게 현장 연구와 실험실 연구로 구분할 수 있다. 현장 연구의 경우, 실제 생활환경에서 현장 설문이나 측정을 수행하여 주관적 평가와 직접적으로 연결하였다. Zhao et al.[47]은 도시 정원 이용자를 대상으로 한 현장 설문을 통하여 공간 및 사회적 요인과 감각지표가 주민 선호에 미치는 영향을 분석하였다. 반면 실험실 연구는 음환경을 인위적으로 통제된 조건에서 참가자의 반응을 수집 및 분석하는 방식이다. 주로 녹음된 음원을 재생하거나 가상현실(Vicar Rural, VR)을 활용하여 평가하는 방식을 활용하였다. Chan et al.[48]은 실험실에서 다양한 시나리오에 대한 사운드스케이프 쾌적성 평가를 실시하였다.

Table 3.

Research design, spatial context, and analytical methods in sensory indicator studies.

Aspect Category Description
Research design[47,48,60] Field studies ∙Based on in-situ acoustic measurements combined with questionnaire surveys
Laboratory experiments ∙Based on controlled listening experiments or VR based simulations
Data types[24,42,43,44] Subjective data ∙Ratings of pleasantness, annoyance, comfort, eventfulness, tranquility, and overall soundscape quality
Objective data ∙Sound level metrics, psychoacoustic parameters, sound source, visual environment indicators
Physiological data ∙Heart rate, HRV, EEG, skin conductance (limited but increasing application)
Spatial context [18,20,22,35,37,50,51,54,55] Urban public open spaces ∙Focus on parks, squares, campuses, and urban green spaces
Road and traffic environments ∙Focus on roadside areas and pedestrian streets dominated by traffic noise
Indoor environments ∙Focus on residential buildings, restaurants, classrooms, and workplaces
Analytical methods [21,24,26,29,44,61,62,63] Statistical methods ∙Correlation analysis, linear/multiple regression, logistic regression, ANOVA
Machine learning ∙CNN, RNN, random forest, gradient boosting, XGBoost

자료 유형 측면에서 살펴보면, 대부분의 연구는 정량적 설문자료(쾌적도, 만족도, 성가심)와 객관적 환경 데이터(소음 수준, 음원 구성 등)를 병행하여 수집·활용하였다. 일부 연구에서는 주관적 평가의 한계를 보완하기 위해 생리적 데이터(심박수, 피부전도, 뇌파 등)를 추가로 수집하여 정서적·인지적 반응을 간접적으로 검증하고자 하였다. Manohare et al.[44]은 교통소음 노출 상황에서 뇌파 반응을 측정하여 소음 자극별 각성 수준을 분석하였다. 최근의 감각지표 관련 연구들은 이와 같이 다중 데이터를 통합적으로 활용함으로써, 지표의 타당성을 정서적·인지적 반응 뿐만 아니라 생리적 반응까지 확장하여 검증하려는 경향을 보이고 있다.[24,42,43]

공간적 맥락에 따른 감각지표 활용을 살펴보면, 연구 대상 공간의 특성에 따라 적용되는 지표와 연구 목적에 뚜렷한 차이가 나타난다. 도시공원과 광장과 같은 외부 공공 공간에서는 자연음과 녹지환경의 역할이 중요하게 작용함에 따라, 음원 구성 비율, 생태 관련 지표, 녹지율 등의 환경적 요소가 주요 변수로 활용되어 왔다.[18,20,37,49] 도로 환경을 대상으로 한 연구에서는 교통소음이 성가심에 미치는 영향을 중심으로 분석하거나, 부정적 소음의 영향을 완화하기 위한 지표를 제안하는 연구가 주로 진행되었다.[22,50,51] 반면 실내 환경 연구에서는 잔향시간과 같은 건축음향적 지표나 음원 유형이 핵심 변수로 활용되며, 공간 이용 목적에 따른 음환경 특성을 분석하는 데 초점을 둔다.[52,53] 예를 들어 식당 음환경을 다룬 연구에서는 배경음악의 유무와 잔향시간이 음향적 편안감에 미치는 영향을 검토하였고,[35,54]주거환경 연구에서는 저주파 소음 지표나 바닥충격음 특성이 거주 만족도에 미치는 영향을 분석하였다.[55]

마지막으로 감각지표 연구에서 활용된 분석 방법은 통계분석과 머신러닝 기법으로 크게 구분된다. 가장 흔히 사용되는 통계 분석 방식은 감각지표와 주관적 평가 간의 관계를 분석하기 위하여 상관분석과 회귀분석이 활용되었다. 특히 선형 또는 다중 회귀모형을 통하여 쾌적도, 만족도, 성가심에 미치는 영향을 정량화하였다.[21,27,56,57] 또 다른 기법으로는 분산분석과 주성분 분석이 있다. 해당 분석기법은 서로 다른 자극 조건이나 시나리오 간 주관적 평가 차이를 검증하고 음환경 인식의 구조적 특성을 해석한다.[44,58,59] 최근에는 통계분석 기법 이외에도 더욱 발전하여 머신러닝 기법을 활용한 연구가 증가하고 있다. 머신러닝 기반 연구는 주관적 반응의 분류 성능이나 예측성능을 활용하며, 다차원 감각지표의 예측 가능성을 평가하였다.[24,26,44] 이와 같이 분석 방법의 확대는 감각지표가 단순히 지표와 인식 간의 관계를 설명하는 것 이외에도 어떻게 구성되어 있는지에 대한 해석과 주관적 음환경에 따른 사람의 반응을 정량적으로 예측하는 방식으로 연구가 발전되고 있다는 것을 나타낸다.

IV. 결 론

본 연구는 주제문헌 고찰을 통해 음환경 분야에서 감각지표를 활용한 연구들을 분석하여 연구 동향과 특성을 체계적으로 분석하였다. 지각·정서적 반응을 설명하거나 예측하기 위해 제안된 감각지표를 대상으로 유형, 구성 요소, 분석 방법을 종합적으로 정리하였다.

감각지표를 활용한 음환경 연구는 크게 지표 개발, 예측식 기반 모델링, 알고리즘의 세 가지 유형으로 구분되었다. 이 중에서 지표 개발과 예측모델에 관한 연구가 대부분을 차지하고 있다. 감각지표의 구성 요소는 물리적 소음지표와 심리음향 지표에서 점차 확장되어 음원 구성, 시각환경 요소, 개인 특성 및 생리 반응을 포함하는 다차원적 지표 체계로 점차 발전되고 있다. 특히 최근에서는 시청각 통합지표와 생태적 지표를 활용하여 복합적인 감각경험을 도출하고자 한다. 분석 방법 측면에서는 회귀분석, 주성분 분석 등 전통적인 통계 분석 기법과 머신러닝 기법이 병행하여 활용하고 있다. 이는 감각지표가 단순한 설명 변수가 아니라 음환경 경험을 정량화하고 반응을 예측 가능하도록 만드는 방향으로 발전하는 것을 나타낸다. 공간적 맥락에서도 차이가 나타났는데 주로 어떤 환경에 노출되어 있는지에 따라 활용되는 방법론과 분석 방식에 차이가 나타났다.

본 고찰을 통하여 기존 연구의 한계와 공백 또한 도출되었다. 첫째, 머신러닝 기법의 적용은 증가하고 있으나, 충분한 표본 규모와 장기적 데이터에 기반한 사례는 여전히 제한적이다. 둘째, 시각적 요소와의 통합연구는 비교적 활발하게 진행되었으나 촉각이나 후각 등 다른 감각과의 연계가 이루어진 연구는 다소 부족하다. 또한 생리적 지표 활용한 연구가 진행되고 있으나 초기 단계에 머물러 있어 주관적 지각반응과 생체반응 간의 관계에 관한 연구가 추가적으로 필요하다. 셋째, 감각지표는 사람의 주관적 인식을 기반으로 하기 때문에 문화적·지역적 맥락에 따른 차이가 발생할 수 있지만 다수의 선행 연구가 동일한 문화권과 장소에 국한되어 문화적 배경에 따른 지표의 변화에 대한 고려는 부족하다.

본 연구는 주제범위 문헌고찰 특성상 개별 연구의 질적 수준을 분석하는 것이 아닌 폭넓은 연구 동향 파악에 초점을 두었다는 한계를 가지고 있다. 또한 문헌 검색 범위 설정으로 인해 일부 관련 연구가 포함되지 않을 가능성이 존재한다. 하지만 본 연구는 음환경 분야에서 진행된 감각지표 연구들을 유형, 구성 방식, 분석 방법의 관점에서 체계적으로 분석하여 그동안 개별 연구 단위의 선행 연구들을 하나의 구조적 틀로 수집 및 분석하였다는 점에서 의미를 가진다. 이는 감각지표를 개별 연구 사례로 국한하는 것이 아니라 지각과 경험을 정량적으로 설명하고 비교하기 위한 핵심 개념으로써 확장될 수 있음을 나타낸다. 나아가 이러한 연구 동향에 관한 체계적인 분석은 감각지표의 학술적 의미 뿐만 아니라 정책 및 실무적 활용을 위한 기반으로 사용할 수 있다. 기존의 소음 관리 방식에 감각지표를 도입하여 인간 중심의 음환경 평가가 도입할 수 있다. 예를 들어 도시 계획 및 환경영향평가 시 기존 소음 관리 기준 이외에도 소음 성가심도나 정온함에 관한 지표를 보조적으로 활용한다면 주민들의 체감 음환경을 보다 정확하게 반영할 수 있다. 또한 도시 공공 공간이나 공원 설계 시 쾌적도에 영향을 미치는 주요 요인을 감각지표를 통해 도출함으로써 사운드스케이프 설계 및 평가를 위한 참고 자료로 활용될 수 있을 것이다.

Acknowledgements

이 연구는 한국연구재단 연구비 지원에 의한 결과의 일부임(과제번호: NRF-2022R1C1C1008066).

부 록

부 록

Table A1.

Scoping review of urban acoustic environment.

Article Descriptors Sound source Spatial context Indicator type Sensory indicators Analysis Study design Sample
size
Lin et al.
(2025)
Soundscape quality Road traffic, urban sounds Urban public open spaces Algorithm-based model LAeq, perceived dominance of road traffic noise, greenery percentage, PET XGBoost, SHAP Field study 1,882
Barros et al.
(2025)
Noise annoyance Road traffic Urban streets Predictive equation/model LAeq, vehicle speed, road surface type, GVI, SC, HR, HF-HRV Mixed-effects models Laboratory 37
Chen et al.
(2025)
Attachment outdoor, indoor, floor impact sounds Indoor residential environments Predictive equation/model Sound-source composition, LCeq–LAeq, floor impact sounds Regression Laboratory 46
Yang
(2025)
Emotional arousal Urban, natural, transport sounds - Indicator N, S, R, F, T, I Correlation, multiple regression Laboratory 33
Zaffaroni-caorsi 
et al.
(2025)
Pleasantness, eventfulness, liveliness Traffic, human activity, biophony University campus Indicator LAeq, ΔLA10–LA90, eco-acoustic indices Multivariate analysis Field study 398
Pasanen et al. (2025) Road traffic noise annoyance Road traffic noise Residential (home surroundings) Predictive equation/model Lden, N.S, nature relatedness, Greenery indicators Logistic regression Field survey 7,321
Yan et al.
(2025)
Tranquility urban sounds Urban public open spaces Predictive equation LAeq, LA10, LA50, LA90, N, S, R, F, T, visual elements, scene characteristics, S.S, visual, scene, tranquility control indicators Multiple regression models Field survey 91 sample site
Chen et al.
(2024)
Soundscape quality Natural, human activity, mechanical sounds Urban forests Indicator PL, EV, SHD PCA, multivariate analysis of variance Field measurement + survey 21 sites
Obama et al. (2024) Auditory saliency Natural, human, mechanical, music sounds - Predictive equation/model Sex, duration, N, spectrum Generalized linear mixed model Laboratory experiment 45
Wang et al.
(2024)
Soundscape's affective quality, momentary stress 28 sound event - Algorithm-based model Spectrogram-based audio features Conventional neural networks, recurrent neural networks - 100+180
Flores-Villa et al.
(2023)
Soundscape and lightscape Traffic, other, human beings,Natural Colosseum and fori imperiali Indicator LAeq, N, S, R, luminance, CRI , CCT Mann–Whitney U test, Kendall’s Tau-b Field survey -
Versümer et al.
(2023)
Day-to-day loudness assessment Human, household, installation, signals, traffic, speech, music/singing - Predictive equation/model LPL, LAeq, LAF5 Linear mixed-effects models Home
(smartphones)
105
Manohare et al.
(2023)
Emotion classes Urban road traffic noise Road Algorithm-based model SPL, 90th SPL, 10th SPL, waveform dynamics, 1/1 octave band, mean frequencies, psychoacoustic indicators, EEG Gradient boosting Laboratory experiment 14
Steffens and Weinzierl
(2023)
Overall restaurant quality Restaurant sound Restaurant Predictive equation/model LAeq15`, RT, PL/EV Structural equation model Field measurements + in-situ questionnaire 142
Hou et al.
(2023)
Sound source classification,annoyance 24 different type - Algorithm-based model Mel spectrogram features, RMS features Dual-input CNN Laboratory experiment -
Ren et al.
(2023)
Environmental health indicators Traffic noise Pedestrian streets Predictive equation/model Visual streetscape, LAeq, C, N, P, A Stepwise/hierarchical multiple linear regression Field measurement + questionnaire 395 (363)
Puyana-romero 
et al.
(2023)
Satisfaction with online education Animals, music, traffic, TV/radio/household appliances, voices Online education at home Algorithm-based model Age, gender, semester, SAT_ONLINE,
INT_SYNCH , INT_AUTO
ANN Model Survey -
Bouzir et al.
(2022)
Pleasantness, loudness Mechanical, non-mechanical Sounds Open public spaces Indicator LAeq,1min, Presence of Mechanical Sounds and Non-Mechanical Sounds Chi-Square Test, Spearman correlation Laboratory experiment 35
Gong et al.
(2022)
Preferences human, artificial, and natural sounds Urban park Indicator S.S, Demographic Variables, Sound level IPA Model, Multinomial Logit Model Field measurement + preference survey 749
Wang et al.
(2022)
Critical perceptions Metro noise - Predictive equation/model LAeq/LCeq/LZeq, N/R, N.S/stance/adaptability Multiple linear regression Lab exposure experiment + multivariate modeling 79
X. Hong et al.
(2022)
Satisfaction urban sound sources Urban open spaces Predictive equation/model L5, L10, L50, L90, L10–L90, L50–L90, LA, LC, LC–LA, D250/D315/D500, N, R, F, S Multivariable linear regression Field measurement + lab subjective evaluation 63 sites
Puyana-romero 
et al.
(2022)
Soundscape appropriateness traffic, aircraft, engine, human, natural, animal, other sounds Urban park Indicator Scenario, S.S, SPL, Visual Context, Demographics RM ANOVA Laboratory experiment 26
Lee et al.
(2022)
Loudness perception community noise Greater boston area Predictive equation/model Sociodemographic, Spatial Variables linear regression - 898
Çakır and İlal
(2022)
Acoustic comfort Speech, activity, ambient indoor sounds eating establishments Predictive equation/model N, S, R, F, RT Regression and comparative analysis Field measurement + laboratory listening tests 70
Lu et al.
(2022)
pleasantness, eventfulness, calmness, vibrancy, appropriateness Traffic, crowd sounds, birds, water Urban residential areas Predictive equation/model N, S, R, GVI, Playground View Index, audio–visual interaction terms Linear regression, moderated regression model Laboratory experiment 32
Jeon et al.
(2021)
potential restorative effects Traffic noise, other noises, human sounds, natural sounds parks, public spaces, commercial streets, and public squares Indicator LAeq, LA10-A90,LCeq-Aeq, Green ratio, Sky ratio, Gray ratio, Luminance, People, Vehicles logistic regression analysis Laboratory experiment 50
Chan et al. (2021) soundscape perception Nature, music, human, mechanical Classrooms Indicator Soundscape Type RM ANOVA Laboratory experiment 209
Versümer et al.
(2020)
sound evaluations and annoyance low- and mid/high-level sounds - Algorithm-based model Situational, Person-related factors Lasso regression Laboratory experiment 35
Zhao et al.
(2020)
resident preference natural, human, artificial sounds Urban gardens Predictive equation/model individual structural variables, social and cultural political variables, spatial variables, LAeq Multinomial logit model Field survey 1,274
Torresin et al.
(2020)
Comfort, content, familiarity Technological, human, natural, music, TV sounds Indoor residential buildings Indicator LAeq,1min, N10, LA10-LA90, N10–N90, R, LC-LA, S Principal components analysis Laboratory experiment 35
Yang and Kang
(2020)
Loudness, reverberation, spaciousness, annoyance, comfort Cildo Meireles Museum Indicator LAeq, N, S, LA10–LA90, LCeq–LAeq, S.S presence , Movement direction Multivariate analysis of variance, independent samples t-test Field study 108
X. Hong et al.
(2019)
Pleasantness Geophony, biophony, anthrophony Urban forests Predictive equation/model POS, WPOS, LAeq Correlation analysis, Stevens’ power law Field exposure + questionnaire 12
Puspagarini et al.
(2019)
Calmness, comfort, overall soundscape perception Traffic, natural, human activity Urban campus park Indicator LAeq, L10, L50, L90, NDSI, AEI, H PCA Field measurement + on-site questionnaire -
Liu et al.
(2019)
Overall soundscape preference Traffic, birdsong, water, human sounds Urban green spaces Indicator Perceived occurrences, N, P, social/visual/contextual factors Correlation and multivariate analysis Field survey 400
Aletta and Kang
(2018)
Perceived vibrancy Mixed urban sounds, human activity, music Urban public spaces Predictive equation/model N, R, F, presence of people and music, visual indicators Multiple regression modeling Laboratory experiment + perceptual survey -
Hong and Jeon
(2017)
Soundscape quality Traffic, human, water, birdsong Multi-functional urban areas Predictive equation/model S.S dominance, N, S, S.Q Global & local spatial regression Field measurement + survey -
Aydin and Yilmaz
(2016)
Pleasantness Traffic, Human, local soundmarks Urban public spaces Predictive equation/model N, S, R Regression analysis, S.Q Laboratory + field validation 53
Boya et al.
(2016)
Preference, loudness, communication, playfulness, richness Traffic noise, human activity, commercial sounds Urban shopping streets Indicator LAeq, psychoacoustic indicators, Dynamic Spectrum Centre Factor analysis, correlation analysis Field survey + laboratory experiment 30
Lindborg and Friberg
(2016)
Pleasantness, eventfulness Urban sounds, restaurant sounds Urban & restaurant Predictive equation/model N, soundscape type, personality traits, N.S Multivariate regression Laboratory experiment 43 + 45
Gozalo et al.
(2015)
Pleasantness / unpleasantness Traffic, building or road work, public transport station, crowded spaces, children, other urban environments Urban outdoor environments Predictive equation/model LAeq, Leq, N, S Logistic regression Laboratory experiment 25
Jeon & Hong (2015) Soundscape classification Traffic, natural, human-made sounds Urban parks Indicator LAeq, Pitch, ACF parameters HCA, DFA, ANN Field measurement 30
Vianna et al.
(2015)
Noise annoyance road traffic noise Urban environments Predictive equation/model Lden, Ln, contextual activity type Chi-Square test, ordered Logistic regression model Field study + socio-acoustic survey 180
Lavandier et al.
(2015)
Sound quality Traffic, voices, footsteps, birds, water, wind Urban public spaces Indicator LAeq, LA10, LA50, LA90, PL, L, N, source dominance Multiple linear regression - 60
Axelsson et al.
(2010)
Pleasantness, eventfulness Traffic, human, natural sounds Urban outdoor environments Indicator Semantic attribute ratings, N10, S.S PCA, Correlation Laboratory experiment 100
Novak et al.
(2010)
Pleasure, arousal, mood, behavioral intent Ambient noise, background music restaurant Predictive equation/model SPL, music presence/type, N.S ANOVA, regression Laboratory experiment -
Jeon et al.
(2010)
%A, %HA Road traffic, construction, water sounds Urban public spaces Predictive equation/model Noise level, noise type combination, presence/level of water sounds Exposure–annoyance modeling, synthesis curves Laboratory experiment -

S: Sharpness; R: Roughness; N: Loudness; F: Fluctuation; T: Tonality; S.Q: Sound Quality; PL: Pleasantness; EV: Eventfulness; A: Annoyance; I: Impulsiveness; L: Liveliness; P: Preference; C: Comfort; CRI: Colour Rendering Index; CCT: Correlated Colour Temperature; LPL: Predicted loudness level; S.S: Sound Source; N.S: Noise Sensitivity; SAT_ONLINE: Satisfaction with the online learning method; INT_AUTO: Interference with autonomous activities; INT_SYNCH: Synchronous activities; WPOS: Weighted POS; POS: Perceived Occurrences of Soundscape; GVI: Green View Index; PVI: Playground View Index

References

1

D. Schwela, “Review of environmental noise policies and actions in 2017-2021,” Sci. Forum J. Health, 3, 329-352 (2022).

10.46981/sfjhv3n4-001
2

G. Dutilleux, T. Gjestland, and G. Licitra, “Challenges of the use of sound emergence for setting legal noise limits,” Int. J. Environ. Res. Public Health, 16, 4517 (2019).

10.3390/ijerph1622451731731688PMC6888303
3

K. Herranz-Pascual, I. Aspuru, and I. García, “Proposed conceptual model of environmental experience as framework to study the soundscape,” Proc. Internoise, 2245-2253 (2010).

4

J. Y. Hong and J. Y. Jeon, “Influence of urban contexts on soundscape perceptions: A structural equation modeling approach,” Landsc. Urban Plan, 141, 78-87 (2015).

10.1016/j.landurbplan.2015.05.004
5

J. K. A. Tan, Y. Hasegawa, S.-K. Lau, and S.-K. Tang, “The effects of visual landscape and traffic type on soundscape perception in high-rise residential estates of an urban city,” Appl. Acoust. 189, 108580 (2022).

10.1016/j.apacoust.2021.108580
6

J. Kang, “Soundscape in city and built environment: current developments and design potentials,” City Built Environ. 1, 1-16 (2023).

10.1007/s44213-022-00005-6PMC9833864
7

M. Ba and J. Kang, “A laboratory study of the sound-odour interaction in urban environments,” Build. Environ. 147, 314-326 (2019).

10.1016/j.buildenv.2018.10.019
8

M. Yang, “A review of regression analysis methods: Establishing the quantitative relationships between subjective soundscape assessment and multiple factors,” Proc. Internoise, 6122-6128 (2019).

9

M. Kastner, A. C. Tricco, C. Soobiah, E. Lillie, L. Perrier, T. Horsley, V. Welch, E. Cogo, J. Antony, and S. E. Straus, “What is the most appropriate knowledge synthesis method to conduct a review? Protocol for a scoping review,” BMC Med. Res. Methodol. 12, 1-10 (2012).

10.1186/1471-2288-12-11422862833PMC3477082
10

Z. Munn, M. D. J. Peters, C. Stern, C. Tufanaru, A. Mcarthur, and E. Aromataris, “Systematic review or scoping review? Guidance for authors when choosing between a systematic or scoping review approach,” BMC Med. Res. Methodol. 18, 1-7 (2018).

10.1186/s12874-018-0611-x30453902PMC6245623
11

E. Ahn and H. Kang, “Introduction to systematic review and meta-analysis,” Korean J. Anesthesiol. 71, 103-112 (2018).

10.4097/kjae.2018.71.2.10329619782PMC5903119
12

J. Kim and Y. Lee, “Color universal design for individuals with color vision deficiency: A scoping review approach” (in Korean), Journal of Korea Design Forum, 30, 283-298 (2025).

13

G. Bae, J. Yang, K. Song, J. Kim, J. Lee, and H. Chung, “A scoping review of living lab literature in Korea: Focused on health and welfare” (in Korean), Health and Social Welfare Review. 42, 248-265 (2022).

14

A.-Y. Kim, Y.-J. Lee, and H.-S. Kim, “Trend analysis of research on the psychological and physical challenges faced by Korean Athletes: A scoping review” (in Korean), Korean J. Converg. Sci. 13, 269-292 (2024).

10.24826/KSCS.13.10.16
15

H. Arksey and L. O’Malley, “Scoping studies: towards a methodological framework,” Int. J. Soc. Res. Methodol. 8, 19-32 (2005).

10.1080/1364557032000119616
16

J. Bae, G. Byun, and M. S. Yoo “Trends in youth studies: A scoping review” (in Korean), Social Welfare Policy, 50, 67-101 (2023).

17

H. J. Seo and S. Y. Kim, “What is scoping review?” (in Korean), J. Health Tech. Assess. 6, 16-21 (2018).

10.34161/johta.2018.6.1.003
18

Z. Chen, T.-Y. Zhu, X. Guo, and J. Liu, “Landscape characteristics influencing the spatiotemporal dynamics of soundscapes in urban forests,” Forests, 15, 1-20 (2024).

10.3390/f15122171
19

T. A. K. Bouzir, D. Berkouk, S. Boucherit, S. Khelil, M. E. Matallah, N. Zemmouri, and S. Boucherit, “Evaluation of soundscape variations through the open public spaces in Saharan cities: a case of Biskra, Algeria,” J. Sustain. Archit. Civ. Eng. 78, 39-51 (2022).

10.5755/j01.erem.78.4.31244
20

J. Liu, Y. Wang, C. Zimmer, J. Kang, and T. Yu, “Factors associated with soundscape experiences in urban green spaces: A case study in Rostock, Germany,” Urban For. Urban Green, 37, 135-146 (2019).

10.1016/j.ufug.2017.11.003
21

G. R. Gozalo, J. T. Carmona, J. M. B. Morillas, R. Vílchez-Gómez, and V. G. Escobar, “Relationship between objective acoustic indices and subjective assessments for the quality of soundscapes,” Appl. Acoust. 97, 1-10 (2015).

10.1016/j.apacoust.2015.03.020
22

T. P. Pasanen, T. Yli-Tuomi, P. Tiittanen, and T. Lanki, “More green, less annoying? The moderating effects of greenery near home, noise sensitivity, and nature relatedness on road traffic noise annoyance,” Urban For. Urban Green, 104, 128625 (2025).

10.1016/j.ufug.2024.128625
23

W. Yan, Q. Meng, Y. Yin, D. Yang, M. Li, and J. Kang, “Predictive models of tranquility in urban public open spaces based on audiovisual indicators analysis,” Build. Environ. 267, 112260 (2025).

10.1016/j.buildenv.2024.112260
24

M. Lin, C. Kwan, H. Cynthia, and S. K. Tang, “Development of an interpretable machine-learning model for capturing nonlinear dynamics of multisensory interactions in public open spaces,” Build. Environ. 280, 113072 (2025).

10.1016/j.buildenv.2025.113072
25

V. Puyana-Romero, J. L. Cueto, I. S. Caizpasto-Sánchez, and G. E. Marcillo-Calispa, “Assessing the soundscape appropriateness in the vicinity of a heliport in an urban park of Quito (Ecuador) using immersive audio-visual scenarios,” Int. J. Environ. Res. Public Health, 19, 6116 (2022).

10.3390/ijerph1910611635627653PMC9140861
26

L. Wang, M.-P. Kwan, S. Zhou, and D. Liu, “Assessing the affective quality of soundscape for individuals: Using third-party assessment combined with an artificial intelligence (TPA-AI) model,” Sci. Total Environ. 953, 176083 (2024).

10.1016/j.scitotenv.2024.176083
27

S. Versümer, J. Steffens, P. Blättermann, and J. Becker-Schweitzer, “Modeling evaluations of low-level sounds in everyday situations using linear machine learning for variable selection,” Front. Psychol. 11, 570761 (2020).

10.3389/fpsyg.2020.57076133192862PMC7644977
28

Y. Hou, A. Mitchell, Q. Ren, F. Aletta, J. Kang, and D. Botteldooren, “Exploring annoyance in a soundscape context by joint prediction of sound source and annoyance,” Proc. 10th Euronoise, 921-924 (2023).

10.61782/fa.2023.0713
29

J. Y. Jeon, P. J. Lee, J. You, and J. Kang, “Perceptual assessment of quality of urban soundscapes with combined noise sources and water sounds,” J. Acoust. Soc. Am. 127, 1357-1366 (2010).

10.1121/1.3298437
30

F. Aletta and J. Kang, “Towards an urban vibrancy model: A soundscape approach,” Int. J. Environ. Res. Public Health, 15, 1712 (2018).

10.3390/ijerph1508171230103394PMC6122032
31

C. Lavandier, P. Delaitre, and C. Ribeiro, “Global and local sound quality indicators for urban context based on perceptive and acoustic variables,” Proc. Euronoise, 1471-1476 (2015).

32

X. Hong, W. Zhang, Y. Chu, and W. Zhu, “Study on subjective evaluation of acoustic environment in urban open space based on ‘Effective Characteristics’,” Int. J. Environ. Res. Public Health, 19, 9231 (2022).

10.3390/ijerph1915923135954584PMC9368173
33

M. Yang, “How auditory sensations affect human emotional responses to acoustic environments,” J. Environ. Manage. 379, 124742 (2025).

10.1016/j.jenvman.2025.124742
34

D. Ç. Aydin and S. Yilmaz, “Assessment of sound environment pleasantness by sound quality metrics in urban spaces,” A/Z ITU J. Fac. Archit. 13, 87-99 (2016).

10.5505/itujfa.2016.75547
35

O. Çakır and M. E. İlal, “Utilization of psychoacoustic parameters for occupancy-based acoustic evaluation in eating establishments,” Build. Simul. 15, 729-739 (2022).

10.1007/s12273-021-0828-1
36

Y. Boya, K. Jian, and M. Hui, “Development of indicators for the soundscape in urban shopping streets,” Acta Acust. united Ac. 102, 462-473 (2016).

10.3813/AAA.918965
37

J. Y. Jeon and J. Y. Hong, “Classification of urban park soundscapes through perceptions of the acoustical environments,” Landsc. Urban Plan, 141, 100-111 (2015).

10.1016/j.landurbplan.2015.05.005
38

X.-C. Hong, Z.-P. Zhu, J. Liu, D.-H. Geng, G.-Y. Wang, and S.-R. Lan, “Perceived occurrences of soundscape influencing pleasantness in urban forests: A comparison of broad-leaved and coniferous forests,” Sustainability, 11, 4789 (2019).

10.3390/su11174789
39

L. Flores-Villa, T. Oberman, C. Guattari, F. Asdrubali, M. Frascarolo, G. E. Puglisi, A. Astolfi, and F. Aletta, “Exploring relationships between soundscape and lightscape perception: A case study around the Colosseum and Fori Imperiali in Rome,” Light. Res. Technol. 55, 603-620 (2023).

10.1177/14771535231156617
40

X. Ren, P. Wei, Q. Wang, W. Sun, M. Yuan, S. Shao, D. Zhu, and Y. Xue, “The effects of audio-visual perceptual characteristics on environmental health of pedestrian streets with traffic noise: A case study in Dalian,” Front. Psychol. 14, 1122639 (2023).

10.3389/fpsyg.2023.112263937063532PMC10102546
41

Y. Lu, Y. Hasegawa, J. K. A. Tan, and S.-K. Lau, “Effect of audio-visual interaction on soundscape in the urban residential context: A virtual reality experiment,” Appl. Acoust. 192, 108717 (2022).

10.1016/j.apacoust.2022.108717
42

A. Barros, F. Pereira, K. Rudnicki, T. V. Renterghem, D. Machado, J. K. Kampen, P. Decorte, K. Poels, E. Sousa, E. Freitas, and C. Vuye, “Psychophysiological stress response to urban traffic: the effect of speed limits, road surface type, and greenery,” Build. Environ. 277, 112921 (2025).

10.1016/j.buildenv.2025.112921
43

N. Obama, Y. Sato, N. Kodama, Y. Kodani, K. Nakamura, A. Yokozeki, and S. Nagami, “Exploring sex differences in auditory saliency: the role of acoustic characteristics in bottom-up attention,” BMC Neurosci. 25, 54 (2024).

10.1186/s12868-024-00909-539448936PMC11515512
44

M. Manohare, E. Rajasekar, and M. Parida, “Electroencephalography based classification of emotions associated with road traffic noise using Gradient boosting algorithm,” Appl. Acoust. 206, 109306 (2023).

10.1016/j.apacoust.2023.109306
45

J. Y. Jeon, H. I. Jo, and K. Lee, “Potential restorative effects of urban soundscapes: Personality traits, temperament, and perceptions of VR urban environments,” Landsc. Urban Plan. 214, 104188 (2021).

10.1016/j.landurbplan.2021.104188
46

Ö. Axelsson, M. E. Nilsson, and B. Berglund, “A principal components model of soundscape perception,” J. Acoust. Soc. Am. 128, 2836-2846 (2010).

10.1121/1.3493436
47

Z. Zhao, Y. Wang, and Y. Hou, “Residents’ spatial perceptions of urban gardens based on soundscape and landscape differences,” Sustainability, 12, 6809 (2020).

10.3390/su12176809
48

Y.-N. Chan, Y.-S. Choy, W.-M. To, and T.-M. Lai, “Influence of classroom soundscape on learning attitude,” Int. J. Instr. 14, 341-358 (2021).

10.29333/iji.2021.14320a
49

Y. Gong, C. Cui, M. Cai, Z. Dong, Z. Zhao, and A. Wang, “Residents’ preferences to multiple sound sources in urban park: Integrating soundscape measurements and semantic differences,” Forests, 13, 1-27 (2022).

10.3390/f13111754
50

Q. Wang, W. Hongwei, C. Yang, and G. Zhang, “Developing multivariate models for predicting the levels of multi-dimensional critical perceptions due to metro noise inside buildings,” Appl. Acoust. 200, 109083 (2022).

10.1016/j.apacoust.2022.109083
51

K. M. D. P. Vianna, M. R. A. Cardoso, and R. M. C. Rodrigues, “Noise pollution and annoyance: An urban soundscapes study,” Noise Health, 17, 125-133 (2015).

10.4103/1463-1741.15583325913551PMC4918656
52

T. Yang and J. Kang, “Subjective evaluation of sequential spaces,” Appl. Acoust. 161, 107139 (2020).

10.1016/j.apacoust.2019.107139
53

S. Versümer, J. Steffens, and S. Weinzierl, “Day-to-day loudness assessments of indoor soundscapes: Exploring the impact of loudness indicators, person, and situation,” J. Acoust. Soc. Am. 153, 2938 (2023).

10.1121/10.0019413
54

J. Steffens and S. Weinzierl, “Noise for dinner – towards a comprehensive statistical model of the acoustical and overall quality of restaurants,” Proc. Forum Acust. 3-5 (2023).

55

K. Chen, J. Kang, and H. Ma, “Perceived attachment to indoor acoustic environments in high-rise residential buildings: Quantization, prediction, and population-based comparison,” Build. Environ. 276, 112771 (2025).

10.1016/j.buildenv.2025.112914
56

C. C. Novak, J. L. A. Lopa, and R. E. Novak, “Effects of sound pressure levels and sensitivity to noise on mood and behavioral intent in a controlled fine dining,” J. Culin. Sci. Technol. 8, 191-218 (2010).

10.1080/15428052.2010.535756
57

V. Zaffaroni-Caorsi, O. Azzimonti, A. Potenza, F. Angelini, I. Grecchi, G. Brambilla, G. Guagliumi, L. Daconto, R. Benocci, and G. Zambon, “Exploring the soundscape in a university campus: Students’ perceptions and eco-acoustic indices,” Sustainability, 17, 1-20 (2025).

10.3390/su17083526
58

S. Torresin, R. Albatici, F. Aletta, F. Babich, T. Oberman, S. Siboni, and J. Kang, “Indoor soundscape assessment: A principal components model of acoustic perception in residential buildings,” Build. Environ. 182, 107152 (2020).

10.1016/j.buildenv.2020.107152
59

D. A. Puspagarini, S. S. Utami, A. S. Sudarsono, and R. F. Fela, “Soundscape study of an urban campus park,” AIP Conf. Proc. 2062, 050011 (2019).

10.1063/1.5095345
60

P. Lindborg and A. Friberg, “Personality traits bias the perceived quality of sonic environments,” Appl. Sci. 6, 405 (2016).

10.3390/app6120405
61

V. Puyana-Romero, A. Mar, G. Ciaburro, and R. Hern, “The acoustic environment and university students’ satisfaction with the online education method during the COVID-19 lockdown,” Int. J. Environ. Res. Public Health, 20, 1-17 (2023).

10.3390/ijerph2001070936613032PMC9819076
62

N. F. Lee, J. I. Levy, M. Luna, and E. D. Walker, “Spatial and sociodemographic determinants of community loudness perception,” Appl. Acoust. 186, 108459 (2022).

10.1016/j.apacoust.2021.108459
63

J. Y. Hong and J. Y. Jeon, “Exploring spatial relationships among soundscape variables in urban areas: A spatial statistical modelling approach,” Landsc. Urban Plan. 157, 352-364 (2017).

10.1016/j.landurbplan.2016.08.006
페이지 상단으로 이동하기