

I. Introduction
II. Temporal smoothing and soft decision for extracting salient chromagram
2.1 Pitch representation and chromagram extraction
2.2 Temporal smoothing for the pitch representation
2.3 Soft decision of chroma activation
III. Experimental results
3.1 Baseline CSI methods and evaluation metrics
3.2 Results
IV. Conclusions
I. Introduction
A chromagram is among the well-established features in music information retrieval.[1,2,3] Assuming an equal-tempered scale, chroma correspond to the set of twelve pitch spelling attributes used in Western music notation. In this scale, different pitch spellings, corresponding to musical note labels, can refer to the same chroma. A chroma vector is typically represented as a 12-dimensional vector, where each element corresponds to a specific chroma. Chromagrams are invariant to octave shifts, meaning they focus on relative pitch rather than absolute frequency, making them robust to transpositions. Moreover, chromagrams are independent of timbre and loudness. These characteristics have been widely utilized in Cover Song Identification (CSI),[4,5,6] which refers to the process of identifying live performances, remixes, or new recordings of previously recorded tracks.
CSI is particularly challenging because variations in timbre, rhythm, song structure, key, and lyrics introduced during cover song generation can result in significantly different cover versions,[4] making chromagram saliency crucial for identifying them. A chromagram vector is extracted over short time intervals (called frames) by quantifying the spectral energy of octave-folded subbands. By aggregating spectral energy into a single octave, chromagrams focus on relative pitch rather than absolute frequency, making them invariant to octave shifts and robust to transpositions, which is essential for cover song analysis. To further improve chromagram saliency, several efforts have been made by focusing on robustness against timbre variations, which are caused by changing singer or instrumentation. Muller and Ewert[1] proposed the chroma DCT-reduced log pitch (CRP), where DCT refers to the discrete cosine transform. The CRP employs higher-order DCT coefficients of the spectral energy, under the assumption that lower-order components are more closely related to timbre and should be suppressed. In Reference [3], the Chroma Trend-removed log Pitch (CTP) was introduced, where trend estimation filters such as the moving average and the Hodrick-Prescott filter[7] were employed to remove the smoothly varying spectral energy component assumed to be timbre-related.
Previous work on salient chromagrams has primarily focused on frame-level saliency, typically by suppressing low-frequency components. As a key contribution of this paper, we incorporate segment- and song-level spectral information by introducing dedicated preprocessing and postprocessing steps into the chromagram extraction pipeline. As a preprocessing step, we apply temporal smoothing, which reduces noise and fluctuations introduced during cover song generation, thereby improving chromagram continuity and mitigating pitch estimation errors. Various temporal smoothing methods have been evaluated for salient chromagram extraction. As a postprocessing step, we introduce a soft decision of chroma activation to determine pitch-class presence more reliably, allowing a gradual transition between inactive and active states. The soft decision function is designed by applying a sigmoid transformation to the modified Z-score of the spectral energy, ensuring resilience to outliers while providing a smooth activation transition. The effectiveness of the proposed temporal smoothing and soft decision is evaluated on the CSI task. Experimental validation is conducted using two CSI approaches across two cover song datasets.
This paper is organized as follows. Section 2 describes chromagram extraction with temporal smoothing and soft decision for CSI. Section 3 presents experimental validation of the preprocessing and postprocessing steps. Finally, Section 4 concludes the paper.
II. Temporal smoothing and soft decision for extracting salient chromagram
2.1 Pitch representation and chromagram extraction
Chromagram extraction is a technique used in music analysis to represent the pitch content of music, focusing on the 12 pitch classes of the chromatic scale. Chroma-based audio features are obtained by pooling a signal’s spectrum into 12 bins, corresponding to the 12 pitch classes (chroma) of the equal-tempered scale. By identifying pitches that differ by an octave, chroma features exhibit robustness to timbral variations and are well-suited for the analysis of Western music, which is characterized by prominent harmonic progressions.[1]
To show the validity of the proposed pre- and post- processing steps, we employ two baseline chromagram methods, CRP[1] and CTP.[3] Both baselines are based on decomposing a music signal into 88 frequency bands with center frequencies corresponding to MIDI pitches p = 21 to p = 108. Further details on frequency band positions and bandwidths are provided in Reference [2]. At each of the 88 subbands, the short-time mean-square power (local energy) is computed. After appending 20 zeroes at the beginning and 12 at the end, as described in Reference [2], a logarithmic compression is applied to construct a 120-dimensional short-time pitch representation X[p, n], where n is the frame index, and p corresponds to MIDI pitches between 1 and 120.
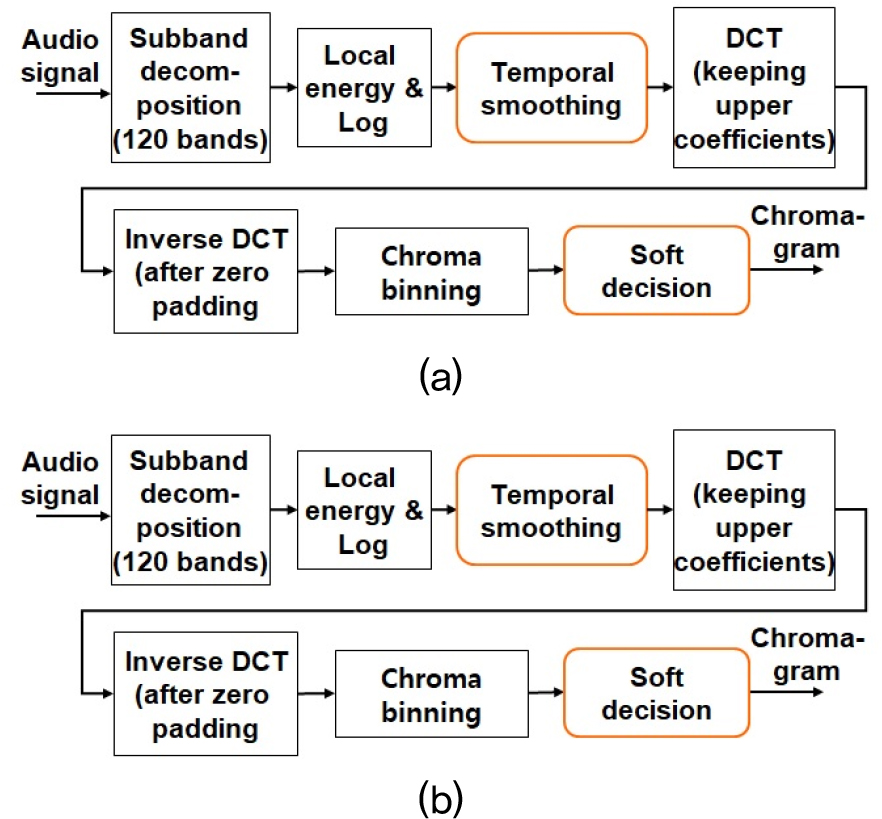
Unlike conventional chromagrams,[2] both CRP and CTP remove slowly-varying components of the pitch representation in each frame, which are claimed to be closely related to timbre and should be eliminated for timbre-invariant representations. In CRP, the slowly-varying components of the pitch representation are obtained by the lower-frequency DCT components of the spectral energy. In CTP, we directly detrend the spectral energy by using the moving average or the Hodrick-Prescott[5] filter which decomposes a signal into two components; medium-to-long term trend component and short-term cycle component. As shown in Fig. 1, for all the frames in X, the CRP and the CTP extraction are performed as follows: 1) estimating slowly-varying components of the 120-dimensional logarithmically compressed pitch representation; 2) subtracting the estimated slowly-varying components from the pitch representation; 3) taking the positive part of the trend-subtracted pitch by the halfwave rectification in case of CTP; and 4) performing chroma binning to derive 12-bin chromagram.
To further improve CSI performance of the CRP and the CTP, which currently rely solely on pitch-directional discriminant feature extraction, we propose pre- and post-processing steps, including temporal smoothing and soft decision of chroma activation.
2.2 Temporal smoothing for the pitch representation
Temporal smoothing plays a critical role in reducing noise while preserving essential signal characteristics across various disciplines, including speech and audio processing, biomedical signal analysis, financial time-series forecasting, computer vision, and climate science. Previous works[1,2,3] have primarily focused on pitch-directional processing for chromagram estimation. In this study, temporal smoothing is employed as a preprocessing step to reduce noise and fluctuations introduced during cover song generation, thereby improving chromagram continuity and mitigating pitch estimation errors.
For chromagram extraction, temporal smoothing is applied to the pitch representation X[p, n] along the n-direction (frame) for each p as shown in Fig. 1. We evaluate four temporal smoothing methods: Gaussian smoothing,[8] Fourier smoothing,[9] morphological smoothing,[10] and shape-adapted smoothing.[11] Each method offers distinct advantages suited to different applications. Gaussian smoothing is effective for local noise reduction, Fourier smoothing removes periodic noise, morphological smoothing preserves edges, and shape-adapted smoothing adapts to structural details.
Gaussian smoothing is a low-pass filter that reduces high-frequency noise while preserving low-frequency components. It smooths the pitch representation by convolving it with a Gaussian kernel. The kernel assigns higher weights to nearby frames and lower weights to distant ones. The filter window size is typically a multiple of the kernel’s standard deviation.
Fourier smoothing reduces high-frequency noise by transforming the pitch representation into the frequency domain, applying a low-pass filter with a cutoff (typically 0.05), and reconstructing the pitch representation via the inverse Fourier transform. Fourier smoothing is known to be effective in removing periodic noise while maintaining the main structure, though sharp cutoffs may introduce artifacts.
Morphological smoothing applies nonlinear filtering to reduce noise while preserving structural details. It operates through erosion (replacing each point with the minimum in its neighborhood, shrinking objects) and dilation (replacing each point with the maximum, expanding objects). Opening (erosion followed by dilation) removes small noise, while closing (dilation followed by erosion) fills gaps and smooths boundaries. We use opening followed by closing to denoise and preserve the overall shape of the pitch representation.
Shape-adapted smoothing, such as anisotropic diffusion (Perona-Malik filtering), selectively smooths regions while preserving edges. This method iteratively updates each point using a diffusion coefficient that decreases at edges, preventing excessive smoothing across boundaries. It is applied to the pitch representation to reduce noise in homogeneous regions while preserving sharp musical note changes.
2.3 Soft decision of chroma activation
Previous works directly utilize the 12-dimensional output of chroma binning in Fig. 1, which adds up the corresponding values of the pitch representation that belong to the same chroma. This paper introduces an additional step, soft decision of chroma activation, following chroma binning for decision-making whether the chroma (pitch class) is actually active or inactive. Instead of hard decision, where only active or inactive are considered, we propose a soft decision method which retains gradual transition between on and off, preserving information about confidence on pitch-class presence.
In this paper, soft decision of chroma activation refers to smoothly mapping the real-valued output of the chroma binning step to a chroma activation score which has a continuous range between 0 and 1. To make this mapping adaptive to the input music signal, we first apply the modified Z-score normalization[12] to and take maximum value as follows:
for the chroma value c =1, 2, ..., 12 where MD(R) denote the median of R, and MAD(R) is computed as the median of the absolute deviations from the median of R as follows:
To incorporate song-level information into the resulting chromagram, both MD(R) and MAD(R) are calculated over the entire sequence R, treating all elements jointly. Unlike conventional Z-score normalization, which relies on the mean and standard deviation, the modified Z-score approach is more robust to outliers and less sensitive to the underlying distribution, which is often difficult to estimate.
To quantify the salience of pitch classes in the chromagram, we propose a chroma activation score based on a sigmoid transformation. This transformation smoothly maps input values into the range between 0 and 1, allowing for soft decision-making rather than binary activation. The chroma activation score for pitch bin c at time frame n is computed as:
where k is the threshold determining decision sensitivity. In the soft decision context, k acts as a threshold that determines when a value is considered activated or not. Typical values of k range from 1 to 5, corresponding to thresholds from MAD(R) to 5MAD(R) above the median. The choice of k should reflect the desired specificity of chroma activation, which may vary depending on the application. The chroma activation score quantifies the dominance of each pitch class at a given moment in the audio signal. Finally the chromagram is obtained by normalizing each 12-dimensional the chroma activation score with respect to the Euclidean norm, ensuring that each vector has unit length.
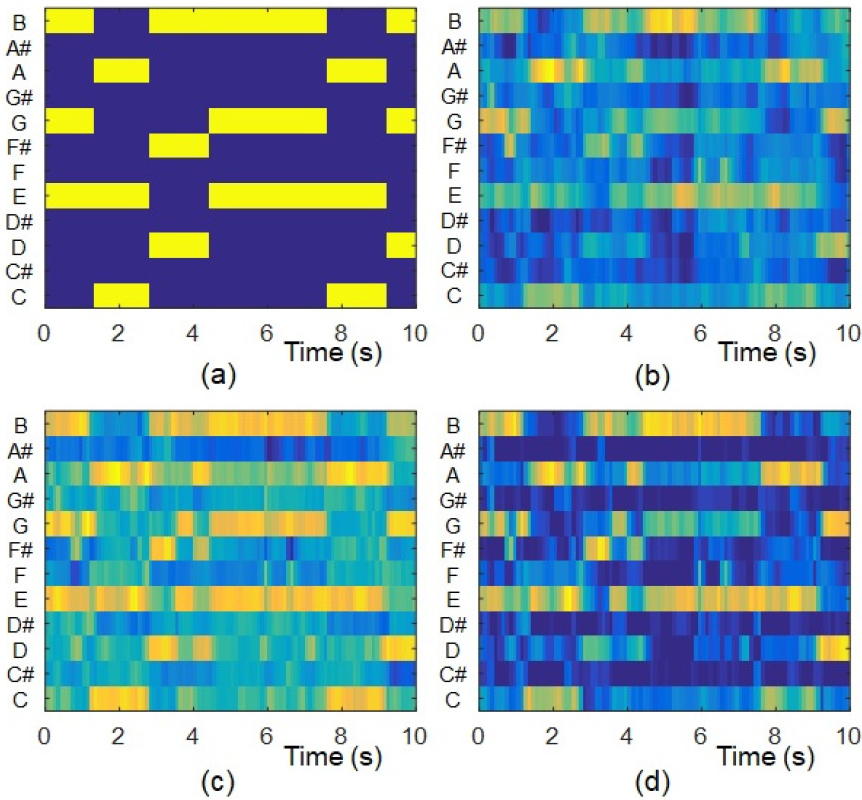
An illustrative example of the chromagram considered in this study is presented in Fig. 2, alongside the ground truth derived from the Isophonics chord annotation dataset.[13] In comparison to the conventional CTP, the postprocessing with soft activation effectively attenuated less prominent false activations while retaining stronger ones, resulting in a chromagram that more closely resembles the ground truth. Additionally, temporal smoothing contributed to the removal of isolated false activations.
III. Experimental results
The CSI performance of the proposed salient chromagram was evaluated on two cover song datasets. The first cover song dataset (abbreviated as covers80) is the one that was used by Dan Ellis in his work.[14] The covers80 consists of 80 original and cover song pairs (160 songs in total), which are available online. The second cover song dataset (abbreviated as covers330) is composed of 1000 songs, where 330 songs are test data (30 original songs and 10 cover versions per each original song), and the other 670 songs were embedded as imposters. The covers330 was collected by the author.
Each song in the datasets was converted to mono at a sampling frequency of 22050 Hz and then divided into frames of 200 ms overlapped by 100 ms where the 12-dimensional chromagram vector was computed as a low-level feature for each frame. The 12-dimensional chromagram vector was normalized with respect to the Euclidean norm to have unit length. In extracting chromagram, we utilized the pitch representation in the chroma toolbox[2] with the default parameter settings. From the pitch representation, we extracted CRP[1] and CTP[3] with the proposed temporal smoothing and soft decision of chroma activation.
3.1 Baseline CSI methods and evaluation metrics
CSI can be performed using two approaches: sequence alignment and song-level feature matching. Sequence alignment-based methods[4] attempt to find the optimal alignment between feature sequences of two songs by leveraging techniques from speech recognition and DNA sequence analysis, such as Dynamic Time Warping (DTW) or Smith-Waterman (SW) distance. In contrast, song-level feature matching methods[6] compute a whole-song or segment-level feature summary, which is then compared with the corresponding summary from another song to assess similarity.
This paper employs two baseline CSI methods to evaluate the extracted chromagram. The first method is based on sequence alignment, where the Optimal Transposition Index (OTI)[4] is used to measure chromagram similarity, and the Smith-Waterman (SW) algorithm[15] is applied for local sequence alignment. The OTI-SW method[4] consists of three modules: preprocessing, similarity matrix creation, and sequence alignment. The second method is musically motivated version embeddings (MOVE),[6] which computes song-level similarity using Euclidean distance between feature embeddings. These embeddings are extracted from a five-layer convolutional neural network with multi-channel adaptive attention. We utilized the experimental code and pre-trained neural network model of MOVE, trained on 44,909 songs, available in a GitHub repository.[16]
Based on the computed music similarity, a ranked list of the most similar songs is generated as potential cover versions of the query. CSI performance is evaluated using mean average precision (MAP) and mean rank of the first correctly identified cover (MR1), following the prior research.[3,4,5,6] MAP assesses ranking performance by considering the positions of all correct cover songs, assigning higher scores to methods that rank multiple covers near the top. MR1 quantifies the position of the first correctly identified cover song, emphasizing early retrieval. Higher MAP values indicate better performance, whereas lower MR1 values are preferable.
3.2 Results
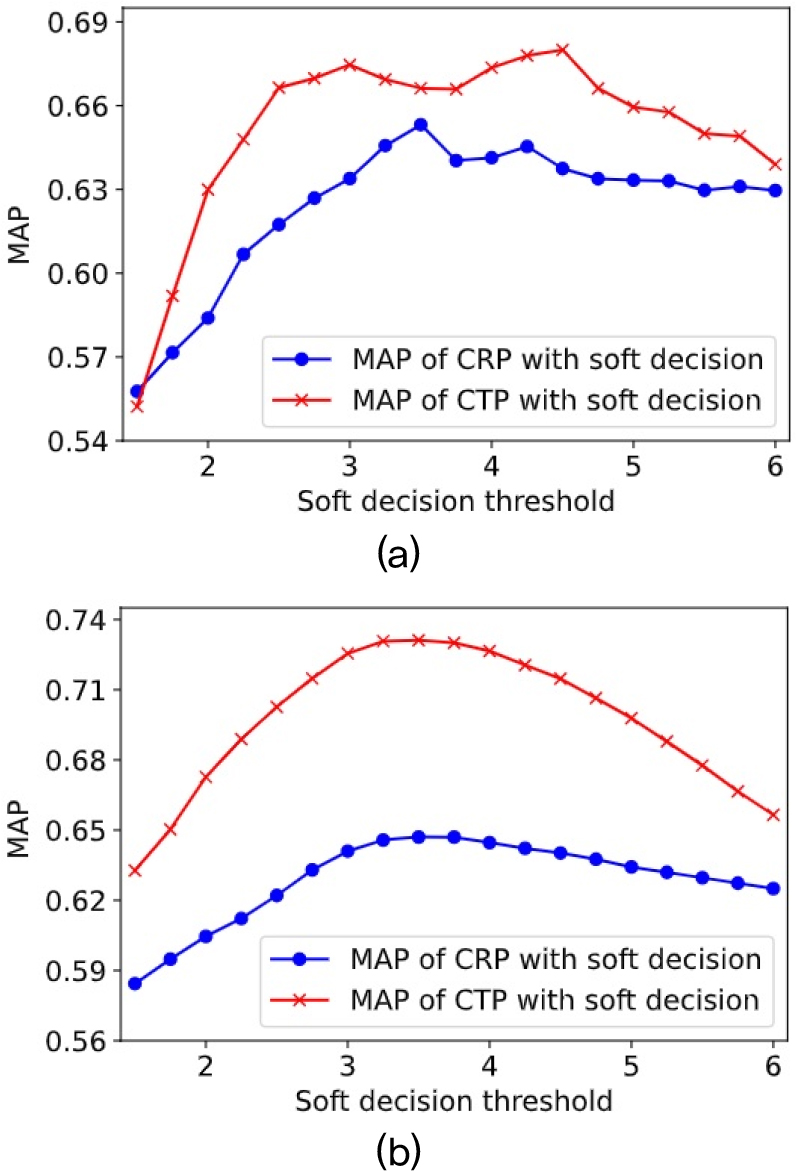
Fig. 3 presents the MAP of CSI using MOVE method for different values of the soft decision threshold k without applying temporal smoothing. The use of soft decision improved MAP for k values between 3 and 5 compared to the MAP without soft decision for both datasets. As k decreases, soft decision exhibits higher sensitivity to activation, leading to an increased number of false activations. Conversely, as k increases, soft decision has lower sensitivity to activation, potentially missing real activations. The highest cumulative MAP across the two datasets was observed at k = 3.5 for the CRP and k = 3 for the CTP. Therefore, these values were adopted in the subsequent temporal smoothing experiments.
Tables 1 and 2 present the CSI performance of the CRP and CTP representations with various temporal smoothing methods, evaluated using the OTI-SW and MOVE CSI baselines on the Covers160 and Covers330 datasets, respectively. The parameters for each temporal smoothing method were selected to achieve the best performance. The parameters for each temporal smoothing method were selected to optimize performance. Notably, prior work[3] employed linear interpolation along the temporal axis for fast sequence matching in OTI-SW, while also reducing the feature rate through decimation. In contrast, the proposed temporal smoothing approaches yielded superior MAP performance compared to Reference [3]. Regardless of the chromagram type, temporal smoothing improved both MAP and MR1 across the two CSI baselines in most cases. Although the improvements were not universal, the overall trend indicates that temporal smoothing provides consistent benefits, enhancing both precision and ranking performance. These results highlight its practical utility in real-world CSI scenarios. Among the evaluated methods, anisotropic diffusion achieved the best performance in most cases, followed by either Fourier or morphological smoothing, depending on the dataset and baseline. These results suggest that preserving sharp note transitions while suppressing noise in homogeneous regions, as achieved by anisotropic diffusion, is critical for improving the CSI accuracy of the chromagram. These findings underscore the importance of selecting appropriate preprocessing and postprocessing strategies in chromagram extraction. Experimental results on two benchmark datasets demonstrate that combining temporal smoothing as a preprocessing step with soft decision postprocessing leads to significant improvements in CSI accuracy.
Table 1.
Cover song identification performance of the CRP and the CTP on the covers80 dataset for different temporal smoothing. The evaluation metrics are mean average precision, MAP, and mean rank of the first correctly identified cover, MR1.
| Temporal smoothing method | CRP | CTP | ||
| MAP | MR1 | MAP | MR1 | |
| Results by using MOVE method | ||||
| Without smoothing | 0.653 | 9.76 | 0.675 | 9.09 |
| Gaussian smoothing | 0.679 | 9.92 | 0.671 | 8.66 |
| Fourier smoothing | 0.678 | 10.66 | 0.676 | 9.04 |
| Morphological smoothing | 0.681 | 11.80 | 0.671 | 10.54 |
| Anisotropic smoothing | 0.674 | 10.12 | 0.705 | 8.66 |
| Results by using OTI-SW method | ||||
| Without smoothing | 0.592 | 21.48 | 0.646 | 18.67 |
| Gaussian smoothing | 0.650 | 18.32 | 0.665 | 17.09 |
| Fourier smoothing | 0.671 | 15.29 | 0.697 | 15.43 |
| Morphological smoothing | 0.670 | 15.97 | 0.682 | 15.54 |
| Anisotropic smoothing | 0.671 | 15.46 | 0.699 | 13.95 |
| Post interpolation[3] | 0.605 | 24.86 | 0.669 | 17.23 |
Table 2.
Cover song identification performance of the CRP and the CTP on the covers330 dataset for different temporal smoothing. The evaluation metrics are mean average precision, MAP, and mean rank of the first correctly identified cover, MR1.
| Temporal smoothing method | CRP | CTP | ||
| MAP | MR1 | MAP | MR1 | |
| Results by using MOVE method | ||||
| Without smoothing | 0.647 | 4.17 | 0.726 | 3.58 |
| Gaussian smoothing | 0.672 | 3.22 | 0.749 | 2.78 |
| Fourier smoothing | 0.675 | 3.09 | 0.757 | 2.09 |
| Morphological smoothing | 0.686 | 2.34 | 0.733 | 3.23 |
| Anisotropic smoothing | 0.687 | 2.72 | 0.767 | 2.12 |
| Results by using OTI-SW method | ||||
| Without smoothing | 0.729 | 7.15 | 0.781 | 5.79 |
| Gaussian smoothing | 0.745 | 5.77 | 0.799 | 5.50 |
| Fourier smoothing | 0.749 | 5.35 | 0.802 | 5.43 |
| Morphological smoothing | 0.742 | 5.32 | 0.794 | 5.27 |
| Anisotropic smoothing | 0.747 | 5.26 | 0.798 | 5.42 |
| Post interpolation[3] | 0.710 | 5.70 | 0.767 | 4.24 |
IV. Conclusions
Enhancing chromagram saliency is crucial for reliable CSI, as cover song generation introduces various distortions. This paper improves chromagram saliency through preprocessing and postprocessing techniques. Temporal smoothing is applied as a preprocessing to reduce noise and fluctuations, enhancing continuity and mitigating pitch estimation errors. As a postprocessing, a soft decision of chroma activation is proposed to more reliably determine pitch-class presence. Experimental results on two datasets demonstrate that both temporal smoothing and soft decision effectively improve cover song retrieval accuracy.
