

I. Introduction
II. Integrated modeling of FEAD and engine main moving system
2.1 Engine main moving system modeling
2.2 FEAD modeling of the current design
2.3 Transmission modeling
2.4 Integrated model for FEAD and engine rotational system
III. The correlation of analysis results with vehicle test
3.1 Operation modes for correlation check
3.2 Vehicle measurement setup
3.3 Simulation and measurement comparisons
3.3.1 Engine cranking modes
3.3.2 Idle N/D range verification
IV. Optimal FEAD layout for new engine
V. Experimental RIG verification of the selected FEAD device combination
VI. Noise enhancement case study
I. 서 론
In the belt driven FEAD (Front End Accessory Drive) system, there are several notorious noises categorized as 1) buzzing 2) chirping, 3) squealing, and 4) tapping. These noises are especially annoying because belt is exposed to air without any sound covering, and they usually arise in low engine rpm, where the engine firing noise cannot mask them. These noises can also be classified as stick-slip and belt span resonance according to the noise mechanisms.
In the field of belt resonances and longitudinal dynamics with no slip condition, there have been many researches in academia. Among them, Mote and Wickert[1] made a pioneering contribution to the industrial belt vibration analysis by modeling the belt as the axially moving beam. Ulsoy et al.[2] argued the stability of the belt dynamic responses and suggested the critical speed of the belt system under which the belt system kept stable. Parker et al.[3] presented an efficient method to calculate the eigensolutions of the serpentine belt system by modeling the belt as the hybrid discrete-continuous system and applying the Galerkin discretization with orthogonal polynomials for the continuous parts.
Aside from the academic achievement, many NVH (Noise, Vibration and Harshness) issues in the belt system due to the stick-slip are far from theoretical estimation. Main difficulties are caused by the complexity of highly nonlinear characteristics of the composite rubber belt and the contact process on the surface of the pulley and the belt. Natural approach to overcome these difficulties is to discretize the whole belt with small segments and the contact condition is checked over each interactions of belt segment and the pulleys, as has been done in well-known commercial multi-body dynamics software such as ADAMS, Recurdyne, AVL PU, Ricardo Valdyn, etc. The pitfall of this method is the excessively long solving time to avoid the numerical instability, precluding the simulation over the diverse engine operating modes with various environment conditions. Moreover, the belt segment is not well characterized by standard analytic element such as beam, string, etc.
Recently, some researchers[4] have made breakthrough advancement in the belt stick-slip analysis both in practical application as well as in the theoretical modeling. First the belt is considered as two string element, one of which corresponding to the contact surface with the pulley and the other corresponding to the power carrying cord of the belt. The important properties of the two string belt model are shear, normal, and bending stiffness of the belt, and the corresponding damping properties. Other important properties are the friction coefficients on the belt-pulley interfaces. These should be measured via strenuous experimental setup on the belt of interest over different types of pulleys. This method was proved to give reasonably good correlation results for the belt slip dynamics, reducing also the analysis time to 1/10th as compared with the other commercial tools.
In this work, the aforementioned belt analysis model was employed to investigate the optimal belt layouts considering interactions with relevant powertrain subsystems. First, the discrete CAE (Computer Aided Engineering) model for the belt drive as well as the engine main moving parts is constructed and its validity has been proven by comparing its results with those of the vehicle test. Second, based on the simulation model, the modification of the current design of the FEAD layout has been suggested to enhance the noise vulnerability especially in wet condition. Third, the optimal FEAD layout for the new engine in the concept design stage has been proposed in terms of NVH, functionality, fuel economy and cost. This layout has been physically constructed and tested in the newly established belt rig. Finally, the whole development procedure of the belt drive system was summarized and the conclusions are drawn.
II. Integrated modeling of FEAD and engine main moving system
To build big analytic model consisting of multiple subsystems, it is recommended to start from small subsystems and integrate those afterwards in a connected final model, which is known as ‘crawl-walk-run’ approach. In this section, the modeling procedure for each subsystem is presented, such as crank train with firing piston, FEAD, transmission with torque converter or dual mass flywheel. In the end, all the subsystems are integrated into one system model.
2.1 Engine main moving system modeling
For the crank train system model, the crankshaft is first considered as in Fig. 1.
The most accurate crankshaft model is the high dimensional FE model as in Fig. 1(a). To reduce the computation time, the FE crankshaft can be replaced by the 3D lumped model as in Fig. 1.(b). Each node in the 3D lumped model contains the mass and stiffness of the surrounding FE mesh. As the main interaction of the belt with the crankshaft is rotational, the interest is confined to the rotational behavior of the crankshaft. Thus, the irrelevant DOFs (Degress of Freedom) of 3D lumped model can be eliminated and only rotational DOFs remain, resulting in the 1D lumped model as in Fig. 1(c). The difference of the crankshaft rotational modes for three models lies within 2 % as shown in Table 1.
| ||
Fig. 1. Simplification of the crankshaft modeling: (a) FEM modeling, (b) 3D discrete modeling, (c) 1D torsional discrete modeling. | ||

Table 1. Torsional mode of the crankshaft. | |||
1st torsion mode | FEM | 3D Discrete | 1D Discrete |
Free-Free | 975 Hz | 987 Hz | - |
Bearing Support | - | 1128 Hz | 1119 Hz |

The in-cylinder pressures apply torques to the crankshaft via reciprocating moving part, and these are also considered as well as the inertia torques by attaching the pistons and conrods to the base crankshaft. The damper pulley is attached to the base crankshaft, where Voigt-Kelvin elastomer is used to connect the inertia ring with the crankshaft nose as shown in Fig. 2.
2.2 FEAD modeling of the current design
In practice, the FEAD system model is provided by the belt system supplier considering the rotational inertia and the corresponding load for each accessory. The current layout of FEAD design contains air-con, alternator and water pump, which are driven by damper pulley via poly V-belt as shown in Fig. 3.
The belt properties and the friction coefficients of the belt-pulley interfaces are measured on the experimental setup as designated by VDA (Verband der Automobilindustric). These are normal, and bending stiffness of the belt and the corresponding damping properties. The experimental auto- tensioner characteristics are provided by the supplier and curve-fitted analytic model is included in the FEAD model.


2.3 Transmission modeling
The torque converter in automatic transmission has two torque paths according to the internal pressure difference, one via lockup clutch or the other via fluid coupling as shown in Fig. 4. In the torque converter modeling, each path is implemented by clutch with switch which is activated for its own function.
In the present powertrain the dual clutch transmission is widely accepted for its fuel efficiency. It is usually equipped with the external damper similar to the dual mass flywheel in the manual transmission. In a simple representation, it is modeled as a two-inertia element with non-linear stiffness and damping as shown in Fig. 5.
| |
Fig. 5. Outer damper of dual clutch transmission. | |
| |
Fig. 6. Integrated analysis model for FEAD and engine rotational components. | |


The gear box for each speed range is considered as an effective inertia with respect to the engine speed.
2.4 Integrated model for FEAD and engine rotational system
All the previously mentioned sub-models from engine to transmission are integrated into one model as shown in Fig. 6. Here, in-cylinder pressure at each piston is the measured data in time or at specific rpm according to the simulation interest. The accessory loads are represented as a curve for each rpm, and the interpolated values are used for a transient time simulation.
III. The correlation of analysis results with vehicle test
To use the established simulation model for further investigation, it should be proved whether it gives correlated results with the experimental results. For the correlation check, the typical engine operation modes are selected in which main belt noises occur, where the important belt dynamic responses are compared.
3.1 Operation modes for correlation check
The engine operational modes for correlation are shown in Table 2. Cranking (Key-on) and idle (N/D range) with changes of humidity (dry/wet) are both measured and simulated for comparisons. In addition, rpm sweep in 3rd gear is also considered with various accessory loads, in which the alternator loads and air-con loads are varied separately for their heaviest and lightest cases.
3.2 Vehicle measurement setup
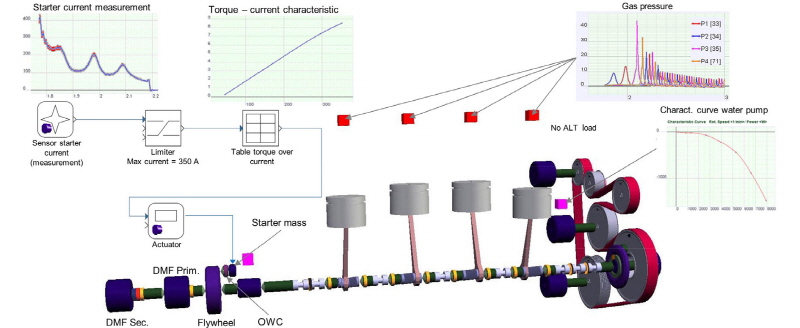
The dynamic characteristic data for belt drive includes 1) overall belt slip, 2) belt span vibration, 3) tensioner movement, 4) dynamic belt tension, etc. In this work, the vehicle measurement was performed to provide the above dynamic data for simulation comparison for the specified operational modes in Table 2. For the overall belt slip, rotary speed at each accessory pulley is measured and the slip ratio on each pulley with respect to belt speed is calculated. The belt speed is replaced with idler pulley speed. Transversal belt span vibration and tensioner movement are measured directly with laser displacement sensors. The crankshaft irregularities are also measured at the core and the rim of the damper pulley. As a note, the crankshaft irregularities are the output of the simulation as opposed to the conventional belt simulation, being caused by the combustion pressure. Thus, the combustion pressure for each cylinder is also measured with crankshaft angle. For cranking simulation, starter current is measured and transformed to starting torque applied to the crankshaft, according to the current-torque curve of the starter. As for engine rotational dynamics, pump speed in the torque converter as well as the input shaft speed in the gear box are measured. These measurement items are shown in Fig. 7.
| |
Fig. 7. In-vehicle measurement for simulation inputs and experimental correlation for FEAD and powertrain rotational dynamics. | |

3.3 Simulation and measurement comparisons
3.3.1 Engine cranking modes
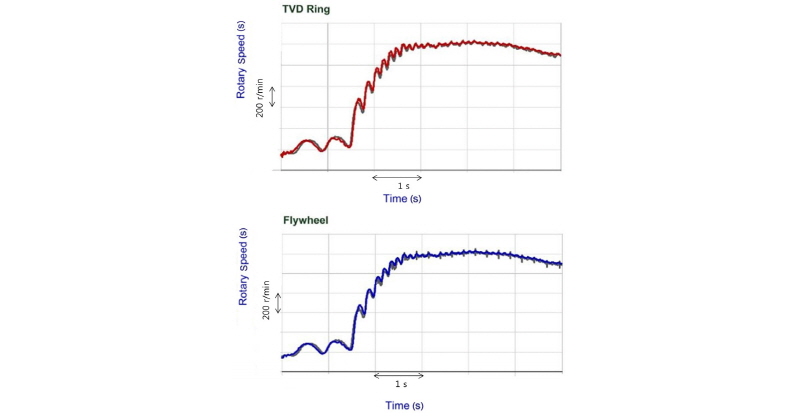
Engine cranking is one of the most difficult modes to simulate. It requires appropriate torque reproduction in simulation model both for the starter and for the combustion pressure. As for the starter, electric current rushes in for a short time, in which the initial current rush is not converted into torque to overcome internal resistance of the starter motor. Thus, as shown in Fig. 8, the starter torque is applied to the crankshaft with a current limiter to neglect the initial current rush.
The simulation and experimental data are compared in Fig. 9. As can be seen, the engine rotational response at every points are almost same with the experimental results.
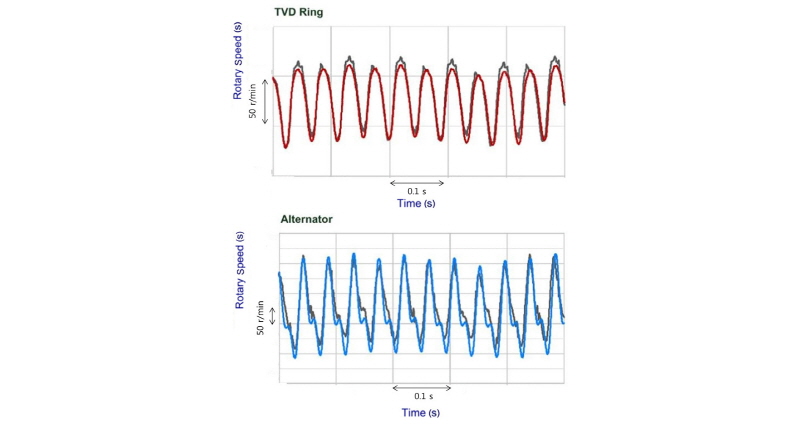
3.3.2 Idle N/D range verification
For the constant engine rpm such as engine idle, the rotary speed is applied at the AT (Automatic Transmission) input shaft as shown in Fig. 10, and the simulation results are also correlated well with the experimental data (Fig. 11).
3.3.3 LOT (Light open throttle) vehicle run-up
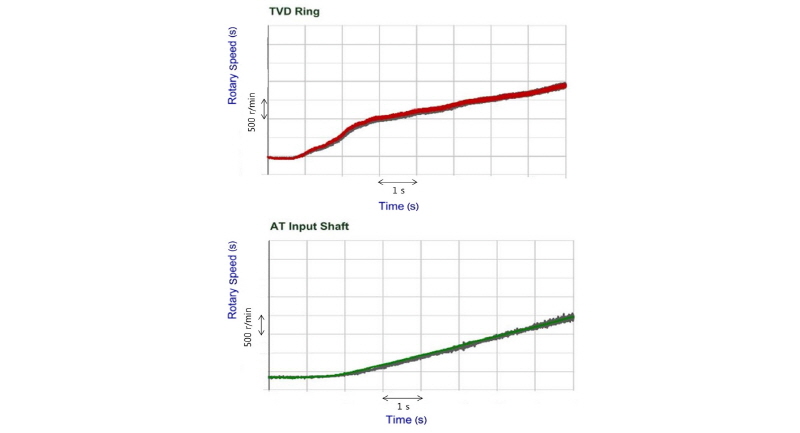
For rpm run-up, the vehicle resistance is also considered such as air drag and rolling resistance in addition to the powertrain system. Fig. 12 shows the simulation results correlate well with the experiments for crank pulley rotation as well as the transmission response
IV. Optimal FEAD layout for new engine
The verified analysis approach in the previous section has been employed to investigate FEAD concept in the new engine design. Although the FEAD layout has significant effects on the belt dynamics, the fixed FEAD layout was suggested by design engineer previously. Thus, the aim of this study is the selection of the proper devices among affordable variations in terms of NVH, durability, fuel economy and cost.
4.1 Variations of models
The possible combinations of the devices for FEAD and crank train are shown in Fig. 13.
To decouple the alternator inertia form the belt drive, OAP (Overrunning Alternator Pulley) and OAD (Overrunning Alternator Decoupler) was considered as opposed to the solid pulley. To reduce the transmission of the engine fluctuation to the belt, crank pulley devices are considered such as torque filter, pulley decoupler, isolation pulley, as opposed to conventional damper pulley. For the crankshaft irregularity itself, a dynamic order damper, so-called CPVA (Centrifugal Pendulum Vibration Absorber) was considered and the application point of it was varied. To keep the total number of analyses in control, 18 combinations are selected as candidates, i.e., 6 variations on the decoupling devices multiplied by 3 variations on the CPVA position.
|
Fig. 10. Constant speed analysis model. |
|
Fig. 11. Correlated response for the engine idle mode. |
|
Fig. 12. Correlated response for the rpm sweep. |

For each device combination, the number of engine operation condition is also reduced to 6 as shown in Table 4. Therefore total number of simulation reaches at 108 cases (18 × 6).
4.2 Assessment of the simulation result: Introduction of grading system
For each simulation case, the resulting dynamic responses are produced such as integrated slip, stick zone, belt tension, tensioner movement, etc. However, as the number of simulation case reaches over 100, it becomes formidable if not impossible to interpret the simulation result.
|
Fig. 13. Possible combination of vibration devices for the FEAD concept design at alternator, crank pulley, and crankshaft. |
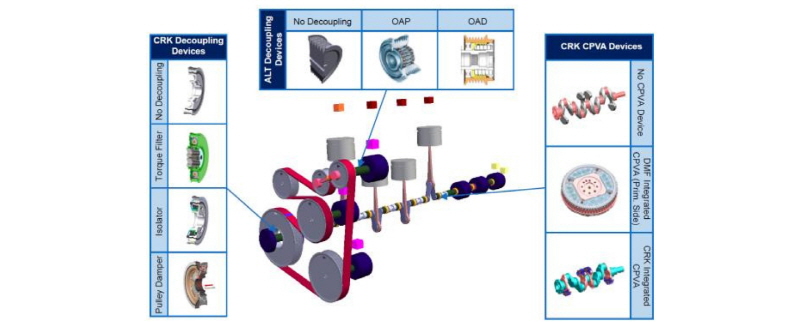
Table 3. Candidates for new FEAD design. | |
Decoupling devices | CPVA position (3 choices) |
No decoupling | No CPVA/Crankshaft/Flywheel |
Torque filter | ↑ |
Isolation pulley | ↑ |
Pulley damper | ↑ |
OAP | ↑ |
OAD | ↑ |
Table 4. Operation condition for candidate survey. | ||
Environment | Operation condition | |
Warm | Dry | 1000-6500 WOT |
Wet | 0-1500 Start | |
Dry | 1000-6500 WOT | |
Wet | 0-1500 Start | |
Cold | Dry | 0-1500 Start |
Wet | 0-1500 Start | |
To avoid this cumbersome interpretation, a grading system was devised as follows. First, for each response characteristic, the lowest acceptable limit is set and the biggest penalty of 5 points was given. As for the best value the lowest penalty of point 1 was allotted. Some critical responses such as integrated slip and max belt tension have their own exclusion value under which the candidate gets out of the list.
The penalty points of 18 candidates are summarized in Table 6, where pulley damper and torque filter seems to be comparably the best choice, irrespective of the CPVA. Along with the lowest cost, the OAP at alternator pulley seems to be the best budget choice.
V. Experimental RIG verification of the selected FEAD device combination
Based on the simulation recommendation, the lowest cost case was tested on the bread board rig (Fig. 13). In the rig, the most severe conditions are simulated including 1000 rpm WOT (Wide Open Throttle), with deteriorated belt and auto-tensioner. Throughout rig tests, it is ensured to be free of malfunctioning of the belt drive with minimum chance of noise generation.


VI. Noise enhancement case study
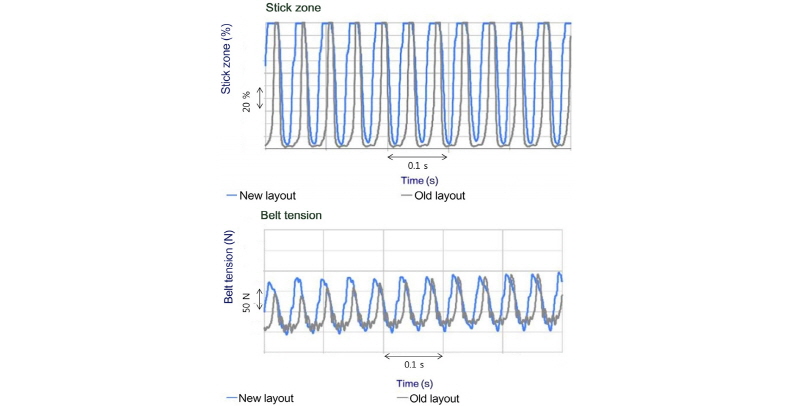
The established simulation method was also utilized for the remedy of the current belt layout design. The current layout has been generating stick-slip noise under wet belt condition and seems to be cured by adding idler pulley in the AC-ALT (Air Conditioner Compressor-Alternator) belt span (Fig. 15).
As can be seen in Fig. 16, the simulation results predicted improvements of stick zone up to 40 % which is marginally acceptable as shown in Table 5, with a small increase of belt tension.
VII. Summary
All the simulation and experimental verification work done were summarized and conclusions were drawn for FEAD development as follows :
1)A newly developed belt simulation tool was adopted for the diverse engine operating modes under various environment, enabling the investigation over large number of candidate designs.
2)The CAE model has proved to be correlated well with experimental results, even for rapid transient simulation cases including cranking, etc.
3)The established model was utilized to find the best candidate FEAD for the new engine design, and the experiment on the rig test shows no drawback for the selected design with more severe conditions.
4)In the other application, a new design was supported by the simulation as opposed to the current FEAD layout with noise under wet condition.
