

I. Introduction
II. Description of the Developed Imaging System
2.1 Design of the Signal Receiving Module
2.2 Implementation of the Signal Receiving Module
III. Performance Evaluation
3.1 Amplification
3.2 Evaluation of Imaging Performance
IV. Conclusions
I. Introduction
PhotoAcoustic Microscopy (PAM) has been in the spotlight as a useful tool for biomedical and medical applications.[1,2,3,4] PA signals are related to the distribution of the target optical absorbers,[5] so that PAM is able to provide high spatial and contrast resolution images of target molecules. Since PA signals have the same frequency range as ultrasound, the signals can be received by an ultrasound transducer.[6] Although PAM can provide high spatial and contrast resolution, it generally suffers from a low Signal to Noise Ratio (SNR) due to the noises induced from a medium, an ultrasound transducer, and a system[7,8] and the artifacts originated from non-targeted chromophores and out-of-imaging plane signals.[7,9,10] For real-time PA imaging based on an array transducer, SNR can be improved by beamformation and frame signal averaging.[11,12,13,14,15] For PAM, however, the signal averaging is generally not viable because the frame rate of PAM is very low and thus there is no room to further reduce the frame rate for SNR improvement. Another possible solution to SNR improvement is the development of an optical lens that is able to effectively focus an incident laser beam only to a desired imaging plane.[13,16] By doing so, laser energy can be delivered into an imaging plane maximally, thus increasing PA signal strength. Since PAM requires the coaxial alignment of the laser and acoustic beam fields by using acoustic and laser mirrors, both laser and PA signals are inevitably attenuated in the integrated sensor module, thus limiting SNR improvement for PAM. Optically transparent transducers recently developed are a viable solution to the optimal coaxial alignment of the two beam fields with a minimal signal loss.[17,18,19,20,21]
Another barrier to SNR improvement is unoptimized signal receivers that are currently implemented with a combination of several pieces of commercially available equipment. For high-quality PAM, a signal receiver should have the ability to receive, amplify, enhance, and digitize PA signals before reconstructing PAM images. For optimal signal reception, electrical impedance matching circuit should be implemented to transfer PA signals received by a transducer with a minimal loss to an imaging system.[22,23] A Low Noise Amplifier (LNA) is generally used to increase the amplitude of PA signals. For signal quality enhancement, a Variable Gain Amplifier (VGA) to compensate depth-dependent attenuation of PA signals and analog filters to remove noise and unwanted signals should be employed before digitizing the PA signals. However, common PAM systems use only an off-the-shelf LNA, digitizer, and trigger signal generator,[24] and the devices are connected with electric signal wires. Therefore, the improvement of PA signal quality is limited because the combination of those devices is not optimal, and additional signal loss and noise generation can occur in the signal wires. Furthermore, the arrangement of common PAM systems causes the system to be bulky, thus hampering efficient use of the system. Note that both high noise and low signal strength affect a Contrast to Noise Ratio (CNR) as well as SNR,[25] and thus an optimal signal receiver can improve both CNR and SNR that are essential image quality metrics.
In the paper, we report a recently developed imaging system for PAM that consists of a hybrid sensor based on an optically transparent transducer, a laser system, a motorized stage and controller, a signal receiving module, and a host computer. Note that this paper contains the experimental results presented in the master’s thesis of Wonkook Han.[26] The signal receiving module is composed of two LNAs, two VGAs, analog filters, an Analog to Digital Converter (ADC), and control logic. Considering a low PA signal amplitude, the receiving module was especially developed to provide an amplification gain as large as possible, but noise as low as possible. For this, the unique arrangement of two LNAs and two VGAs was employed. Since PA signals generally have a wide spectral bandwidth,[6] the receiving module was designed to have a wide operating bandwidth with a small magnitude fluctuation. The imaging performance of the developed PAM was evaluated through in vitro experiments in terms of SNR and CNR improvement.
II. Description of the Developed Imaging System
Fig. 1 shows the block diagram of the developed imaging system for PAM. A Nd:YAG laser source (Surelite EX, Continuum Inc., Santa Clara, CA, USA) generates laser pulses with a width of 7 ns at a rate of 10 Hz, and the wavelength of the laser pulses is adjusted to a desired value in the optical parametric oscillator (Surelite OPO Plus, Continuum Inc., Santa Clara, CA, USA). The laser pulses are delivered into an objective lens through a custom-made optical fiber bundle. The role of the objective lens is to reduce laser beam size, so that the laser pulse can efficiently pass the optically transparent transducer without energy loss in the case of Acoustic Resolution PAM (AR-PAM). A detailed description of the transducer can be found in[17] and the main characteristics are summarized in Table 1. For Optical Resolution PAM (OR-PAM), the laser beam can be focused more tightly using an objective lens with a high numerical aperture. The simple scheme for the integration of optical and acoustic modules enables us to easily replace the object lens and the transducer according to imaging purpose. The transducer is immersed into a container filled with deionized water to detect PA signals generated from a specimen. For image scanning, the container is placed on a motorized 3-axis XYZ stage (SGSP26-100, SIGMAKOKI Co. Ltd., Tokyo, Japan). Whenever a laser pulse is generated, the laser system transfers a trigger signal to the signal receiving module. The host PC sends a signal to the motorized stage controller in order to move the stage to a desired position for the next image line. After completing the stage movement, the host PC commands the signal receiving module to receive and record PA signals from the transducer after the next trigger signal. The PA signals are digitized in the signal receiving module after improving signal quality and sent to the host PC for image reconstruction. The key element of the developed imaging system is the signal receiving module that will be described in more detail.
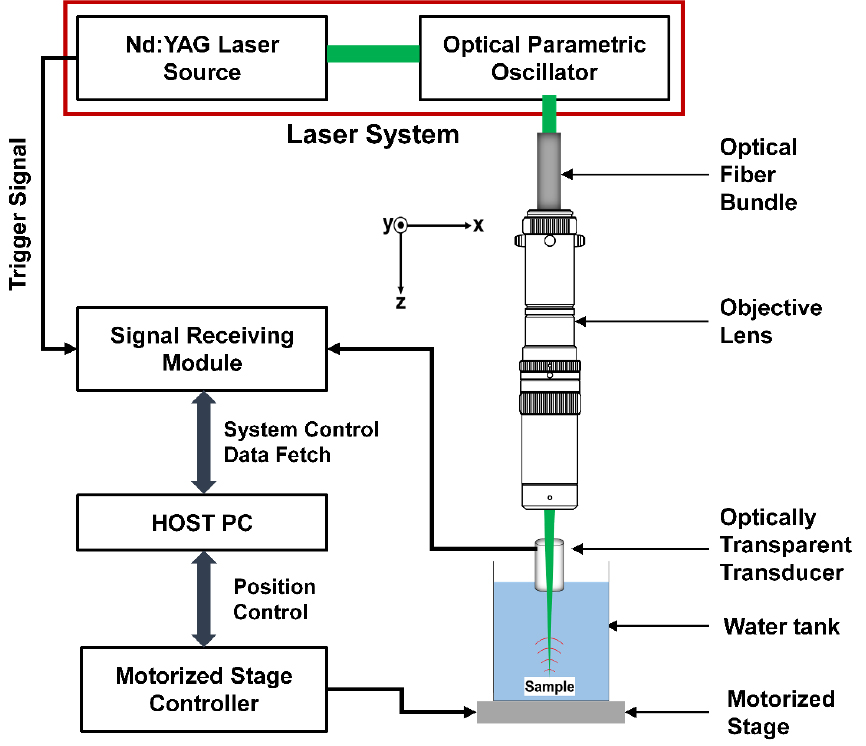
Table 1.
Characteristics of the custom-made optically transparent focused transducer.
| Center frequency (MHz) | 11.2 |
| -6 dB fractional bandwidth (%) | 23 (i.e., 9.9 MHz to 12.5 MHz) |
| Element size (mm) | 7 × 7 |
| Focal length (mm) | 6 |
| Depth of focus (mm) | 1.78 |
| Lateral resolution (μm) | 182 |
2.1 Design of the Signal Receiving Module
Fig. 2 shows the signal receiving module that consists of an analog frontend block, an Analog Time Gain Compensation (ATGC) block, and a digital control block. The module has the capability to amplify input signals over 70 dB at an operating frequency range of 5 to 70 MHz. This value was determined by considering the common amplitude of the received PA signal and the input voltage range of an ADC. Note that the operating frequency range of 5 MHz to 70 MHz was determined by considering the frequency of the transducers typically used for OR-PAM and AR-PAM.[1,27] Additionally, the gain flatness was designed to be less than ±1 dB because high gain flatness is desirable to avoid the distortion of PA signals. Importantly, a typical signal amplification block consisting of one LNA and one VGA is difficult to meet the requirements: one major factor in this problem is that high-gain amplifiers generate high-amplitude noise. As shown in Fig. 2, to overcome the hurdle, the unique arrangement of LNAs and VGAs was devised: two LNAs and two VGA are arranged alternately. This configuration also prevents signal saturation through the amplification block. Note that we previously developed a low-noise, wideband ultrasound receiver for high-frequency ultrasound imaging with an arrangement similar to that of the current receiver.[28] The main difference between both receivers is the location of a Low Pass Filter (LPF) that is placed between the first LNA and the first VGA. The purpose of repositioning the LPF from after the first VGA to before was to remove the harmonic components generated by the first LNA with a relatively high gain.
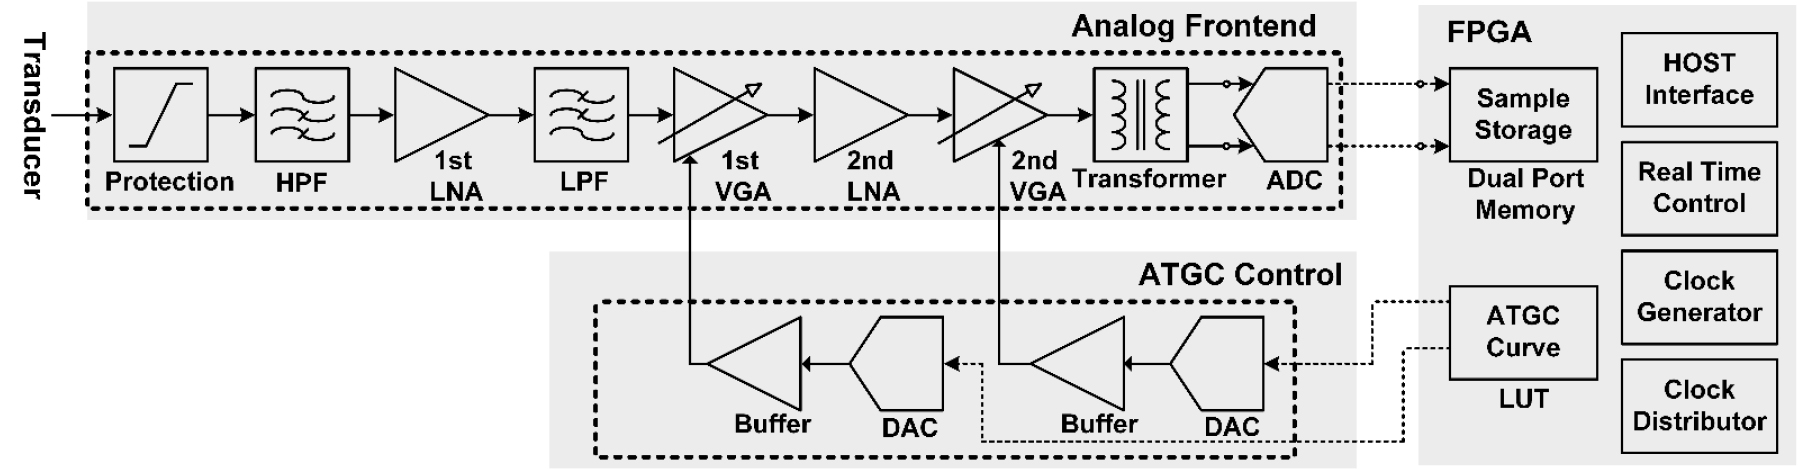
Like ultrasound signals, the received PA signals generally contains noise, and it is categorized into white noise and low frequency noise.[29] The noise is removed by an analog High Pass Filter (HPF), called generally a DC canceller, placed behind a system protection circuit consisting of three diodes. As a result, SNR can be increased. In this study, the HPF was designed to have a cutoff frequency of 5 MHz. The denoised signals are amplified in the first LNA (AD8000, Analog Device Inc., Norwood, MA, USA) with a low input voltage noise of 1.6 nV/√Hz and an amplification gain of 20 dB. Before further amplifying the denoised signals in the first VGA block, low-pass filtering is performed by the LPF with a cutoff frequency of 70 MHz to eliminate the harmonics produced inside the LNA. Note that both HPF and LPF were Chebyshev type I filters with five poles. Because the VGA (AD8337, Analog Device Inc., Norwood, MA, USA) with an adjustable amplification gain of -6 to 18 dB was used for ATGC, the first amplification block can change the signal gain from 14 dB to 38 dB. In the second amplification block (i.e., another set of LNA and VGA), the PA signal is further increased, depending on the PA signal amplitude received by a transducer. As a result, the signal receiving module can theoretically increase the PA signal amplitude up to 76 dB.
The ATGC control block adjusts the VGA gains by changing the gain control voltage. It is desirable that the VGA gains be constant for OR-PAM. This is so because the frequency-dependent attenuation is not critical for OR-PAM due to its shallow imaging depth. In this case, therefore, the main role of the ATGC control block is not only to use the full input voltage range of an ADC, but also to avoid signal saturation after amplification. On the other hand, for AR-PAM, the VGAs can play an important role in compensating for signal loss due to the frequency- dependent attenuation and diffraction of PA signals because AR-PAM should provide a relatively deep imaging depth. Since the loss occurs exponentially as a function of imaging depth, ATGC curves are designed to compensate for this loss along imaging depth and stored in FPGA (Field Programmable Gate Array; XC6SLX75, Xilinx Inc., San Jose, CA, USA) in the digital control block. The two DACs (AD5424, Analog Devices Inc., Norwood, MA) are used to generate gain control voltages to vary the gains of the two VGA according to the ATGC curves.
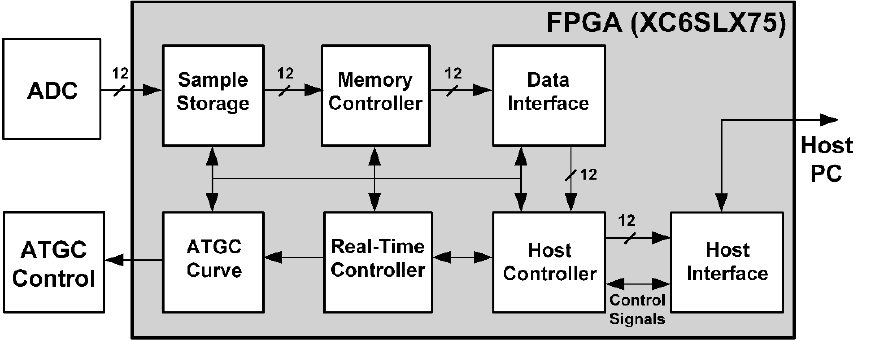
The two 1:1 RF transmission line transformers (ETC1- 1-13, MA-COM, Lowell, MA, USA) are responsible for changing the type of the output signal of the second amplification block from a single-ended signal to a differential signal. This helps to minimize the effects of ElectroMagnetic Interference (EMI) and crosstalk noises, and thus maintain the SNR of the amplified PA signals. As shown in Fig. 3, the PA signals are digitized to 12 bits at a rate of 250 MHz in the ADC (AD9626, Analog Device Inc., Norwood, MA, USA), and the PA samples are stored into the internal memory of the FPGA. The digital control block is responsible for transferring the PA samples to the host PC and controlling the ATGC block and the ADC. The data transfer to the host PC is based on USB 3.0 protocol communication. All the functional blocks in FPGA were implemented using Verilog.
2.2 Implementation of the Signal Receiving Module
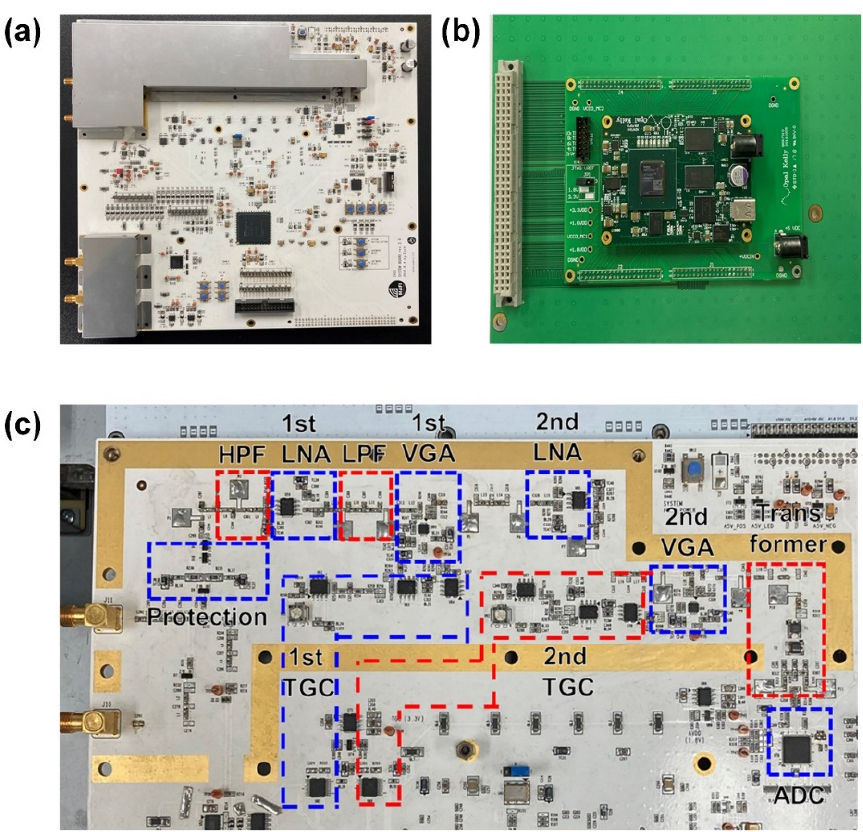
As shown in Fig. 4(a), the signal receiving module was implemented on the Printed Circuit Board (PCB) with 9 signal layers and 7 ground layers. The PCB was made of FR-4 material and is 2.4 mm thick, and it had separated analog and digital regions in order to avoid the digital signal interference to the analog signals. The size of the PCB was 270 mm × 260 mm. Since the electrical impedance matching is particularly important for small PA signals,[30] the characteristic impedance of all the transmission lines on the PCB was implemented as 50 Ω by selecting the dimensions of the transmission lines. As shown in Fig. 4(a) and (c), additionally, metal-shield-caps were used for shielding the analog region from EMI, thus minimizing the effects of external noise on the analog signals in the PCB. The metal shield cap was designed based on calculation of a cavity resonant frequency to prevent cavity resonance occurring below a few hundred MHz. An Opal Kelly evaluation board (XEM7310MT-A200, Opal Kelly Inc., Portland, OR), integrated into the PCB of the signal receiving module [see Fig. 4(b)], was used to communicate between the signal receiving module and the host PC.
III. Performance Evaluation
3.1 Amplification
The developed signal receiving module plays a major role in amplifying the received signals in the frequency range of interest with high gain flatness. To evaluate these factors, the transfer functions of the HPF and LPF were first measured using a network analyzer (E5061B, Keysight Technologies, Santa Clara, CA, USA). The measurement was performed by applying a power of 0 dBm to the input port of each filter. From Fig. 5(a) and (b), it was seen that the filters had the designed cutoff frequencies: 5 MHz for the HPF and 70 MHz for the LPF. To evaluate the amplification performance of the developed module, a power of –40 dBm was applied to the input of the protection block and the transfer function was measured at the output of the second VGA (see Fig. 2); the total amplification gain was about 24 dB in 5 MHz – 70 MHz (i.e., the desired operation frequency range) when the gains of each VGA were –6 dB. Note that the total VGA gain in this case was –12 dB. The 4-dB difference between the theoretical and measured values resulted from a signal attenuation of 3 dB in the protection block and 1 dB in the two analog filters [see Fig. 5(c)]. The maximum amplification gain was measured after the two VGA gains were set to be the maximum (i.e., 18 dB each); the measured value was about 72 dB. The flatness over the operation frequency range was less than ± 1 dB as measured by changing the amplification gain. Through the evaluation results, it was confirmed that the developed signal receiving module satisfies the desired amplification performance.
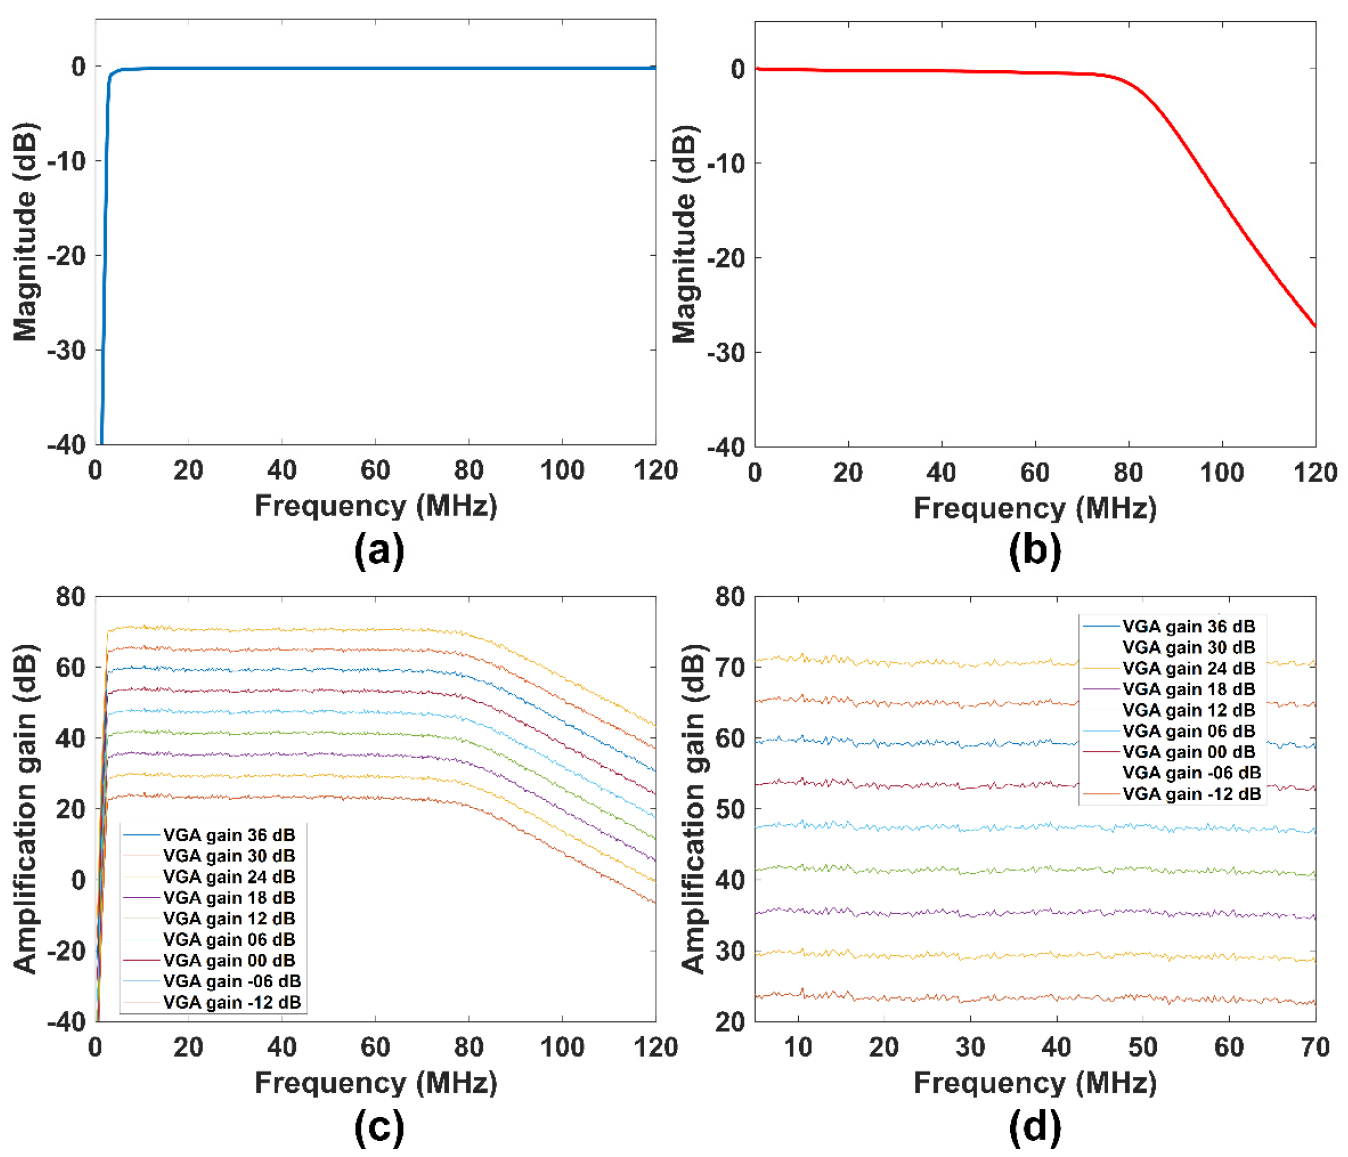
Fig. 5.
(Color available online) Measured transfer functions of (a) the analog HPF and (b) LPF, (c) the measured amplification gains of the developed signal receiving module when the total gain of the two VGAs was changed from -12 dB to 36 dB, and (d) the zoom-in version of the amplification gains over the operation frequency range, i.e., 5 MHz - 70 MHz.
3.2 Evaluation of Imaging Performance
To evaluate the imaging performance of the developed system, a skeleton leaf vessel was stained using blue ink and fixed inside the acrylamide phantom fabricated according to the previously reported recipe [see Fig. 6(a)].[31,32] The phantom was immersed into the water container on the motorized stage as shown in Fig. 1. For the imaging, an objective lens (VZM™ 600i Zoom Imaging Lens, Edmund Optics Inc., Barrington, USA) with a numerical aperture of 0.25 were used. The laser system generated laser pulses with a wavelength of 532 nm and an energy of 1.1 mJ/cm2. Note that the blue ink absorbed maximally at the wavelength. The phantom images were acquired using a commercial signal receiving system (UT340, UTEX Scientific Instruments Inc., Mississauga, ON, Canada) and a high-speed digitizer (CS1422, Gage Applied Technologies Inc., Montreal, QC, Canada) for performance comparison with the developed system. A detailed description of the combination of several pieces of commercially available equipment can be found in the paper.[33] Both systems acquired 150,801 scanlines with 20 μm scanning intervals, which corresponds to a scanning area of 10 mm × 6 mm. For the imaging, the total amplification gain of the developed system was 32 dB with the VGA gain fixed at –6 dB. The total amplification gain of the commercial system was also 32 dB. Note that, for OR-PAM, it was not necessary that the VGA gain was changed to compensate for the frequency-dependent attenuation. This was so because the thickness of the stained skeleton leaf vessel (i.e., 100 μm) was significantly greater than the depth of focus (DOF) of the transducer used for this study (i.e., 1.78 mm).
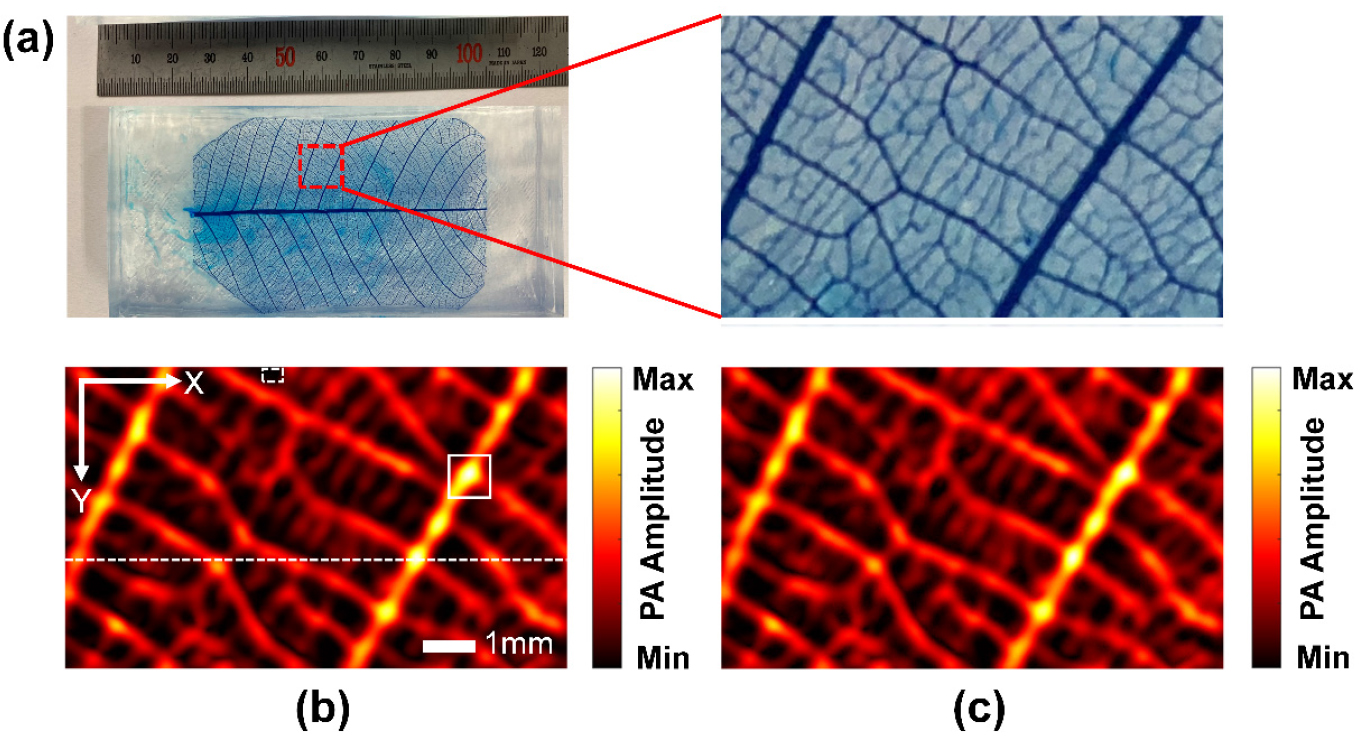
Fig. 6.
(Color available online) (a) Photographs of the stained skeleton leaf vessel phantom (left) and the zoom-in version of the imaging area (right), (b) PAM image acquired by the combination of several pieces of commercially available equipment, and (c) PAM image by the developed system. SNR was measured using the PA signals generated in the region indicated by the white dashed line in (b), and CNR was measured using the envelope signals within the two white boxes in (b).
Both CNR and SNR were measured for quantitative performance comparison. For the CNR measurement, signal and background regions were selected. CNR was obtained from
where and are the average magnitudes of signal envelopes in the signal and the background regions, respectively. and are the standard deviations of those envelope signals. For Maximum-Amplitude-Projection (MAP) images, SNR was obtained as a function of scanlines consisting of one line on a PAM image by using
where and indicate the scanline and the sample, and are the signal and noise envelope samples of the scanline, respectively, and and are functions representing the maximum and the standard deviations of the samples indicated by on a scanline . Note that Eq. (2) is a modified version of the conventional equation used for SNR measurement,[28,34] based on the fact that the measured signal also contains noise.
Fig. 6(b) and (c) show the PAM images acquired by the commercial and the developed systems, respectively. Note that the images were reconstructed based on the MAP algorithm. The signal and background regions used for the CNR measurement are indicated by the white solid and dashed boxes in Fig. 6(b), respectively. As shown in Fig. 7(a), the CNR of the PAM image acquired by the developed system was 36 dB, whereas that by the commercial system was 33 dB. As a result, the developed system provided a 3 dB higher CNR than the commercial system. On the other hand, Fig. 7(b) shows the SNR values corresponding to the line indicated by the white dashed line in Fig. 6(b), which were calculated using Eq. (2). The average SNRs of the developed and the commercial systems were 35.7 dB and 31.0 dB, respectively; in terms of SNR, the developed system outperformed the commercial system by 4.7 dB.
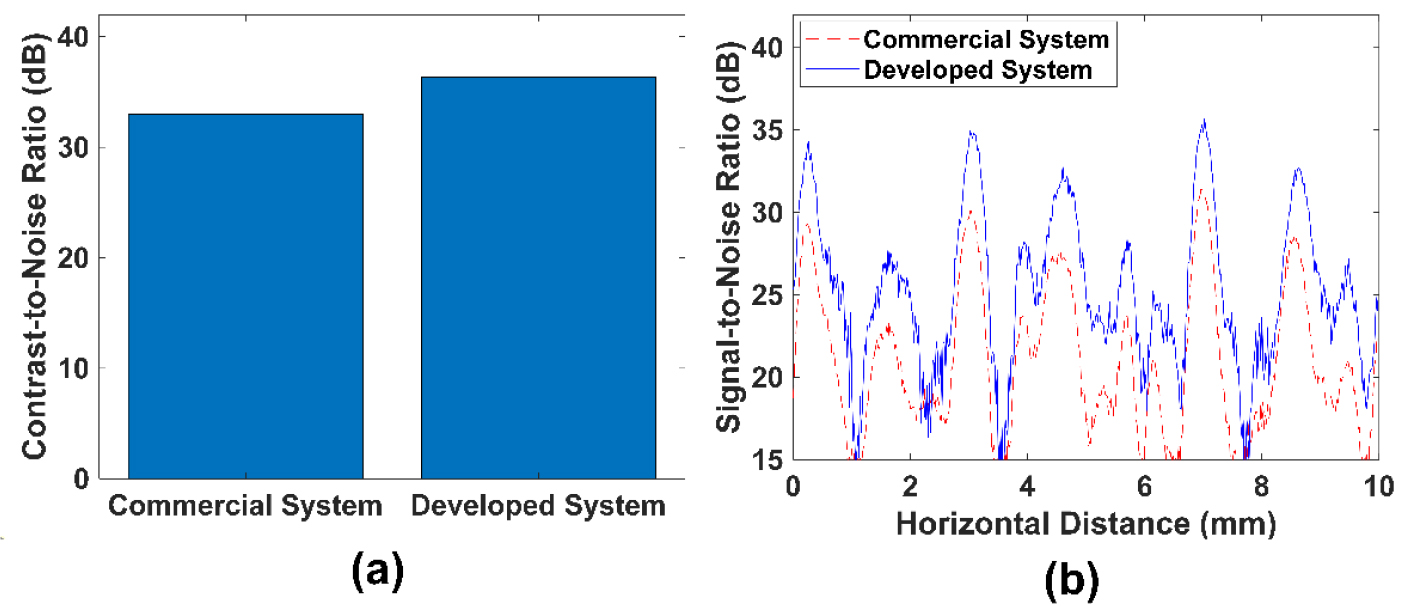
Fig. 7.
(Color available online) (a) Measured CNR and (b) SNR of the PAM images in Fig. 6(b) and (c).
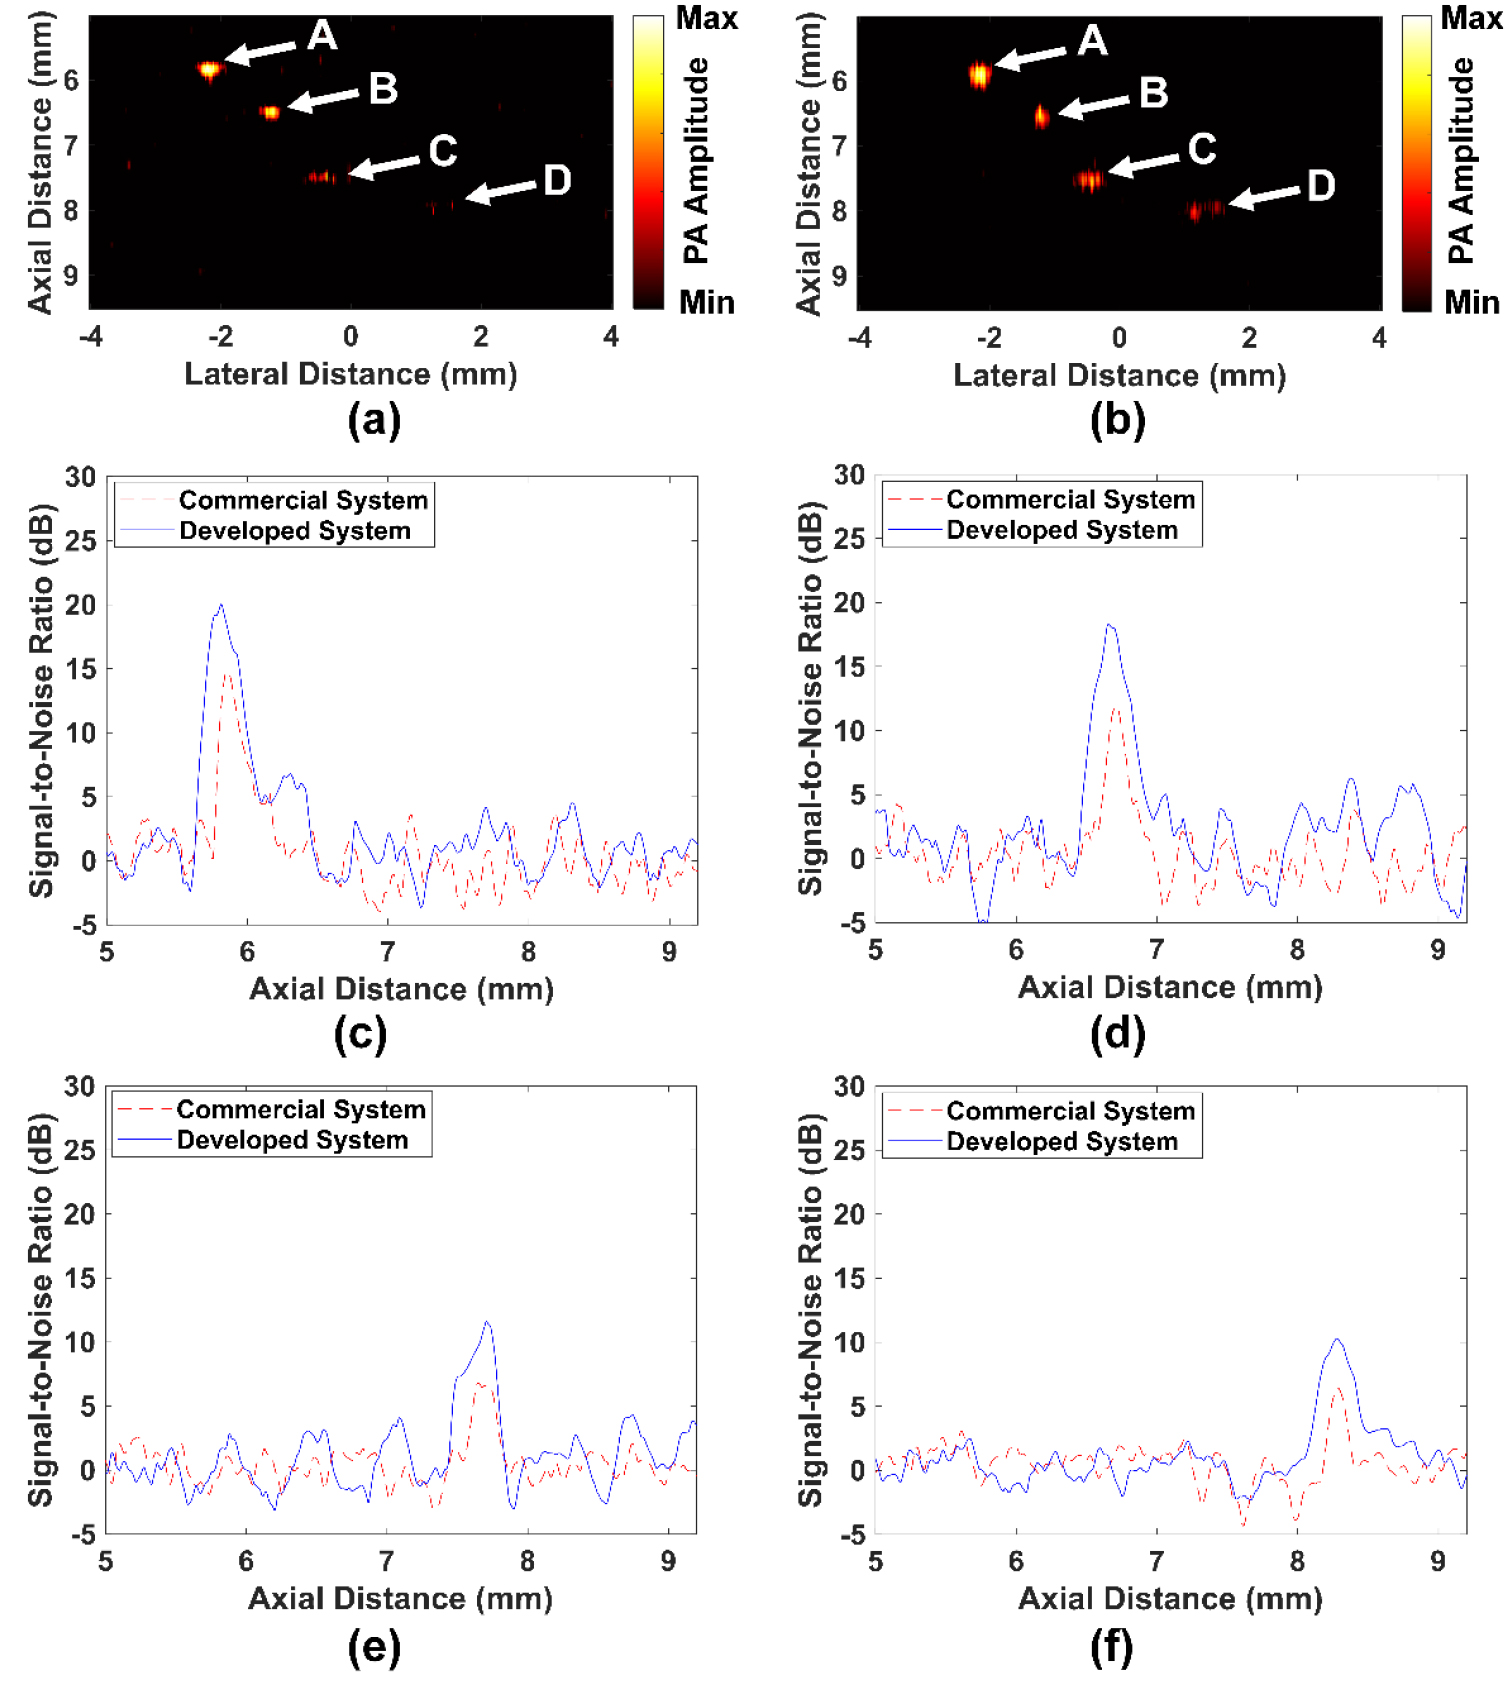
The effect of the two VGAs on SNR was ascertained based on the B-mode PA image of wires with a diameter of 100 μm. For the experiment, four gold wires were placed 5.8 mm, 6.6 mm, 7.7 mm, 8.2 mm away from the transducer. In other words, the first wire was at the focus of the transducer, and the third and fourth wires were located outside the DOF. The amplification gain of the commercial system was fixed to be 32 dB. On the other hand, the amplification gain of the developed system was linearly increased from 32 dB at a depth of 5.8 mm to 36 dB at a depth of 7.8 mm by adjusting the gains of the two VGAs through the ATGC control block. For imaging, 601 scanlines were acquired at 20 μm intervals. Unlike the C-plane image, SNRs of the B-mode images were obtained using[35]
where is the average function of a variable . For this study, was set to be 4. Note that Eq. (3) provides the SNR plot as a function of imaging depth.
The B-mode PA images acquired by the commercial and the developed systems are shown in Fig. 8(a) and (b), respectively. The first and second wire images (labeled by A and B) around the focal depth were clearly seen in both systems. For the two wire images, however, the developed system provided 5.3 dB and 6.7 dB higher SNR, respectively, than the commercial system; the SNRs of the label A and B images were 20.0 dB and 18.3 dB for the developed system, whereas those were 14.7 dB and 11.6 for the commercial system [see Fig. 8(c) and (d)]. Since the third and fourth wires (label C and D) were located outside the DOF, the two wire images acquired by the commercial system were barely visible., In contrast, the developed system could provide clearer images due to its ATGC capability. The SNRs of the third and fourth wire images were 11.6 dB for and 10.3 dB for the developed system, whereas those were 6.6 dB and 6.4 dB, respectively, for the commercial system [see Fig. 8(e) and (f)].
IV. Conclusions
From a system developer’s point of view, PA signals are intractable to construct high quality images because they are broadband but weak and thus susceptible to noise. Nevertheless, a non-optimized combination of several commercial instruments has been used to acquire PA signals for PAM. In this paper, we have demonstrated that the developed system outperforms the commercial system in terms of SNR and CNR of PAM images. The unique arrangement of the two LNAs and two VGAs is one of key factors for this superior imaging performance because it facilitates the ATGC function suitable for PA imaging. In particular, the ATGC function was more beneficial for AR-PAM than for OR-PAM because the compensation for frequency-dependent attenuation is more effective for AR-PAM of which imaging depth is deeper than that of OR-PAM. The operating bandwidth of the developed system can be adjusted by changing the cutoff frequencies of both analog HPF and LPF; it can be increased up to 120 MHz. Also, the developed system can be used for high- frequency ultrasound imaging such as Intravascular Ultrasound (IVUS) and ultrasound endoscopy (EUS) that typically deals with smaller signals than conventional ultrasound imaging. In conclusion, we believe that the developed signal receiving system will be a fundamental component for the commercialization of high-quality combined US and PA imaging systems in the near future.
