

I. Introduction
II. Equivalent circuit of the loudspeaker with acoustic terminals
III. Verification through experiment
3.1 Extract of and
3.2 Determination of acoustic impedance and sound absorption coefficient
IV. Conclusions
I. Introduction
To reduce noise in a room, sound absorptive materials are a prerequisite and therefore are widely used in the buildings. When developing sound absorptive materials, sound absorption performance should be monitored in every developing step for better results. Also in designing a new acoustic environment of a room, measurement of sound absorption of the candidate materials could guarantee the correct estimation of the reverberation time.
Methods of sound absorption coefficient measurement are internationally standardized in ISO354 (reverberation room method)[1] or ISO10534-2 (transfer function method in the impedance tube).[2] Reverberation room method is based on the condition of 100 % diffuse field and therefore it gives practically realistic values of sound absorption coefficients. It has a drawback, however, as it sometimes gives more values than 1.0 of sound absorption coefficient due to the edge effect of the specimen installation, which is not theoretically acceptable. Also internal volume of 200 m3, precise temperature and humidity control, 5 microphones and the relevant measuring systems mean a big investment.
The transfer function method was proposed in the 1980s[3,4] and has been internationally standardized, but the problem was that only the sound absorption coefficient under the condition of normal incidence could be obtained, the hassle of calibration of two or three microphones, and uncertainty in the low frequency ranges.
In addition to these two methods, other attempts were also proposed. Farina proposed the sound intensity method rather than the transfer function method, and emphasized that the method was more advanced.[5]
In particular, new attempts are still limited, as neither the reverberation chamber method nor the transfer function method provides a reliable solution for the measurement of the sound absorption coefficient below 100 Hz.[6]
In this paper, a new method of measuring acoustic properties of the materials, which is especially consistent at the low frequencies is proposed: It does not employ the microphones or the long tube to measure sound pressure at all and instead utilize the equivalent circuit of the loudspeaker to extract acoustic impedance of the specimen, which again converts to sound absorption coefficient with ease.
II. Equivalent circuit of the loudspeaker with acoustic terminals
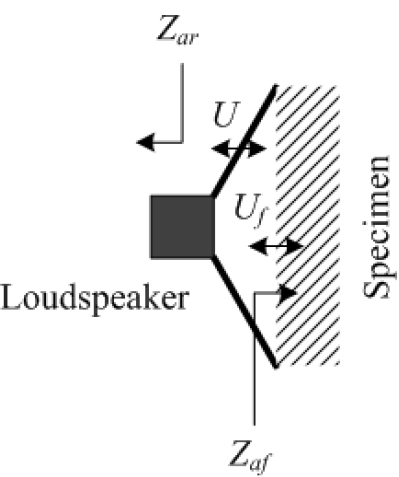
If a specimen is installed near the loudspeaker diaphragm as shown in Fig. 1, when the volume velocity of the diaphragm is , a volume velocity different from is applied to the specimen surface due to the elasticity of air formed between the specimen and the diaphragm. If the acoustic impedance at the back of the diaphragm is and the acoustic impedance at the surface of the specimen installed in front of the diaphragm is , the equivalent circuit of the loudspeaker at low frequency ranges where the diaphragm of the loudspeaker vibrates as a piston can be expressed as shown in Fig. 2,
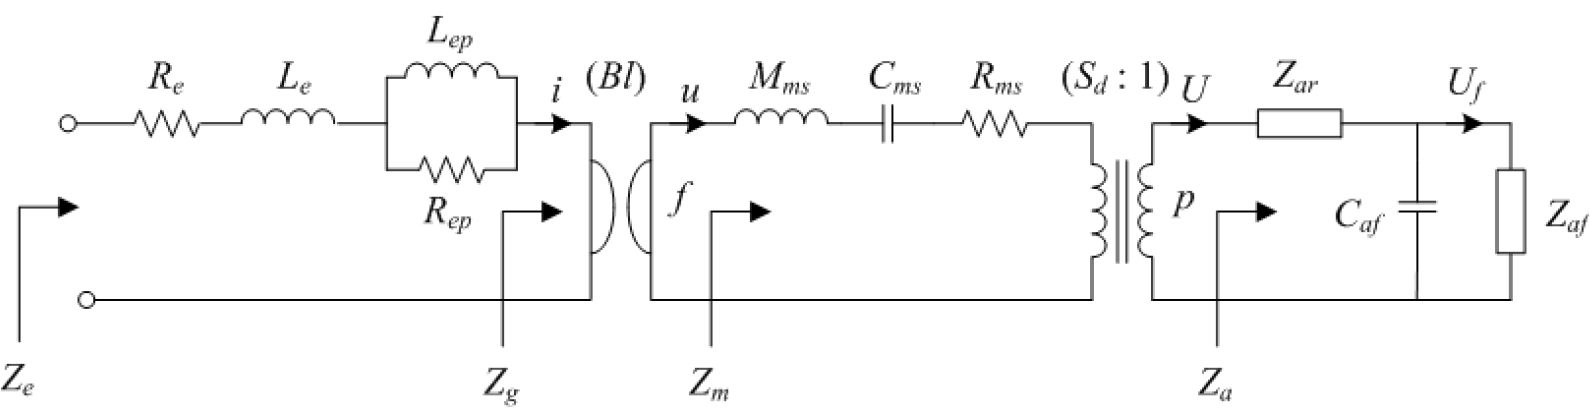
where,
: series DC resistance
: series coil inductance
: parallel inductance associated with coil loss
: parallel resistance associated with inductance
: mass, compliance, and loss of the moving diaphragm of the loudspeaker respectively
: acoustic impedance at the rear of the loudspeaker
: acoustic impedance of the test specimen
: compliance of the cavity between the loudspeaker diaphragm and the test specimen
: force factor of the loudspeaker
: effective diaphragm area of the loudspeaker
: acoustic, mechanical, and electrical impedance of the loudspeaker seen from the each terminal respectively.
Acoustic impedance which is defined as pressure over volume velocity denotes as
For simple manipulation of the equations, motional impedance can be defined as
Mechanical impedance of the loudspeaker reduces to
Electrical impedance of the loudspeaker incorporating electrical, mechanical and acoustical elements can be written as
Also, electrical impedance excluding resistances and inductances of the voice coil equates as
Eq. (5) implies that can be indirectly calculated by measuring the electrical impedance of the loudspeaker and extracting the Thiele/Small parameters.
If the specimen is replaced with a rigid surface, the front acoustic impedance becomes infinite and the acoustic impedance is simplified to
In the condition that the front cavity of the loudspeaker is small and the frequency is low, becomes dominant, and the is connected in series with the of the loudspeaker. This lowers the total compliance, which increases the resonance frequency of the loudspeaker. can therefore be readily calculated by
where is the loudspeaker resonance frequency in free air and is that when the front cavity is small as in Fig. 1.
Also, volume of the front cavity of the loudspeaker can be calculated by the simple relation of
From Eqs. (3) and (6), is expressed as
where
Eq. (9) is then reduced to
Boulandet[7] used an enclosure to measure the acoustic impedance of the loudspeaker, but in this study, it can be easily measured by changing the loudspeaker compliance with only the space formed between the front and the hard surface of the loudspeaker. Several manipulations of the above equations yield the acoustic impedance of the specimen as
Absorption coefficient is then calculated using the relation of
where is the acoustic impedance of plane wave traveling in air.
III. Verification through experiment
3.1 Extract of and
To verify the effectiveness of this study, the loudspeaker impedance has been measured. The loudspeaker used in the experiment was a small full-range loudspeaker with an effective diameter of 70 mm, and the Praxis system of Liberty Instruments was used as a measurement and analysis system. Using the impedance measurement data along with the added mass method, Thiele/Small parameters, which are the values of each element on the equivalent circuit in Fig. 1, have been extracted. The loudspeaker impedance graph measured in free air and that with the front of the loudspeaker blocked with a rigid panel are shown in Fig. 3. It resonated at 104 Hz in free air and at 435 Hz when the loudspeaker surface was blocked, and has been calculated using Eq. (7).
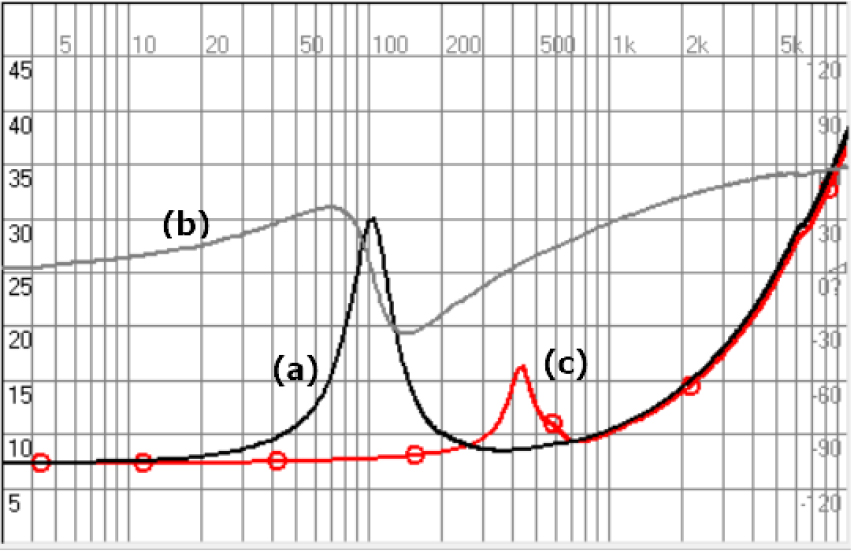
Fig. 3.
(Color available online) (a) Magnitude of electrical impedance of the loudspeaker in free air, (b) phase of it, and (c) magnitude when the front side is blocked with a rigid surface as in Fig. 1.
Since and used to obtain have in the denominator, the lower the frequency, the larger the their values. This means that the derivation of precise Thiele/ Small parameters is very important to obtain accurate . Even with very small Thiele/Small parameter errors, reacts largely to represent an impractical value, and Boulandet’s study[7] also exemplifies this phenomenon.
Theoretical real and imaginary values of the acoustic radiation impedance of the piston radiator and the pulsating sphere similar to that of a loudspeaker decrease as the frequency decreases as shown in Eqs. (14) and (15),[8]
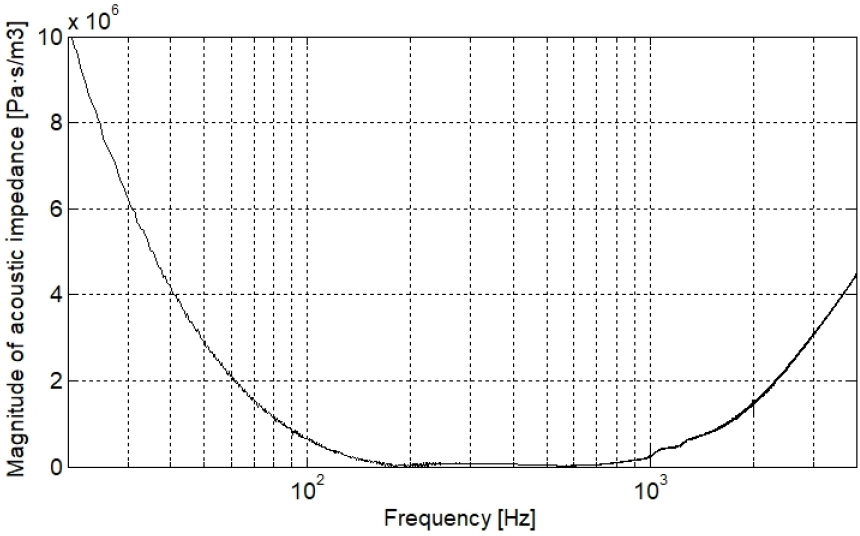
For the case where the air cavity at the rear of the specimen is 50 mm, the acoustic radiation impedance has been calculated using Eq. (11) and is shown in Fig. 4. For frequencies above the intermediate frequency, the impedance increases rapidly, showing a graph similar to the theoretical slope of the radiation impedance of the piston radiator or pulsating sphere as in Eqs. (14) and (15), but at low frequencies below 200 Hz, the acoustic radiation impedance increases as the frequency decreases. This is a phenomenon that appears in other papers,[7,9] and more in-depth analysis of the cause is required.
3.2 Determination of acoustic impedance and sound absorption coefficient
The loudspeaker impedance has been measured by flush-mounting the specimen into a cylindrical pipe with an inner diameter of 48 mm and installing the loudspeaker in close contact with the surface of the specimen as shown in Fig. 5.
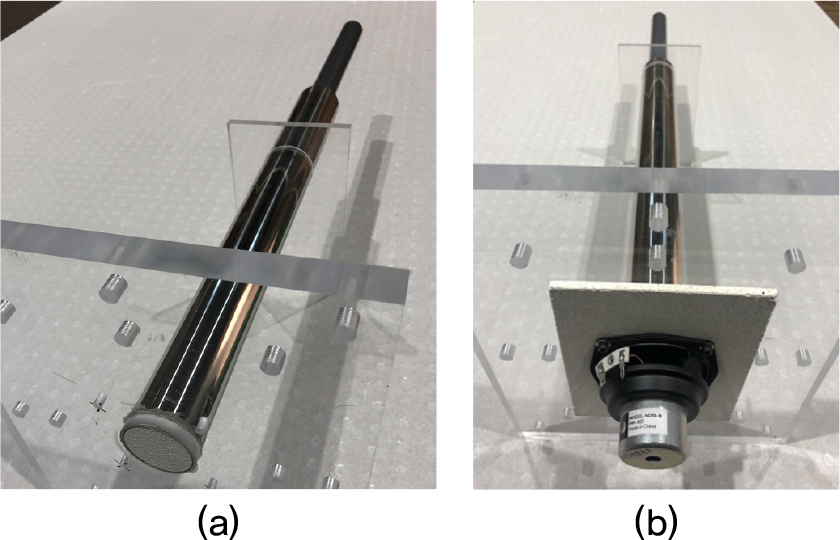
Fig. 6 shows a graph of loudspeaker electrical impedance curves while changing the air cavity on the back of the specimen. Q is the largest when there is no rear air cavity, and it decreases as the rear air cavity deepens. As the condition of the specimen changes, the electrical impedance of the loudspeaker changes accordingly, which implies that the impedance of the loudspeaker acts as a important clue in measuring the acoustic impedance and the sound absorption coefficient. One thing to note is that above about 1 kHz, the impedance graph is almost identical regardless of the air cavity, which means that the loudspeaker no longer has sufficient sensitivity as a sensor.
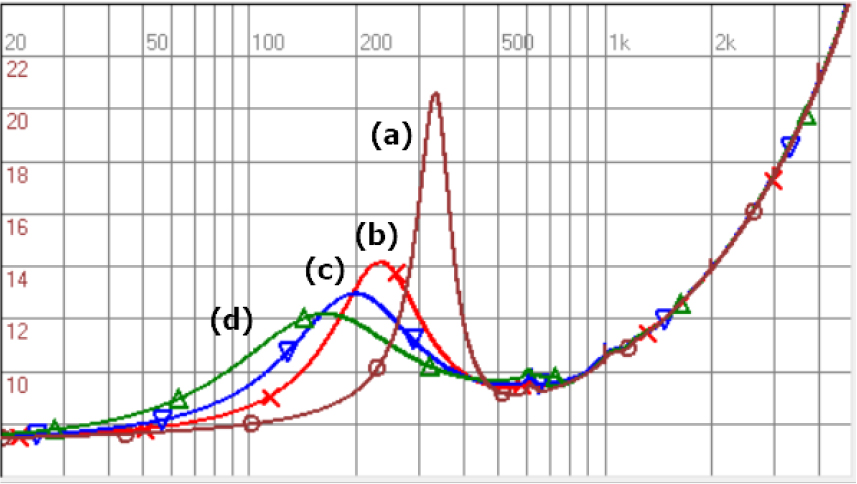
Fig. 7(a) is the measured graph of the acoustic impedance at the surface of the specimen. The acoustic impedance of the plane wave has been overlaid in Fig. 7(b) for comparison of the values. It is informative to note that the more spacing (a) and (b) are, the greater the amount of the reflection. Above about 1 kHz, the graph fluctuates very strongly because the sensitivity to sense through the loudspeaker is low and the assumption of lumped element modeling is difficult to apply due to the breakup vibration of the loudspeaker.
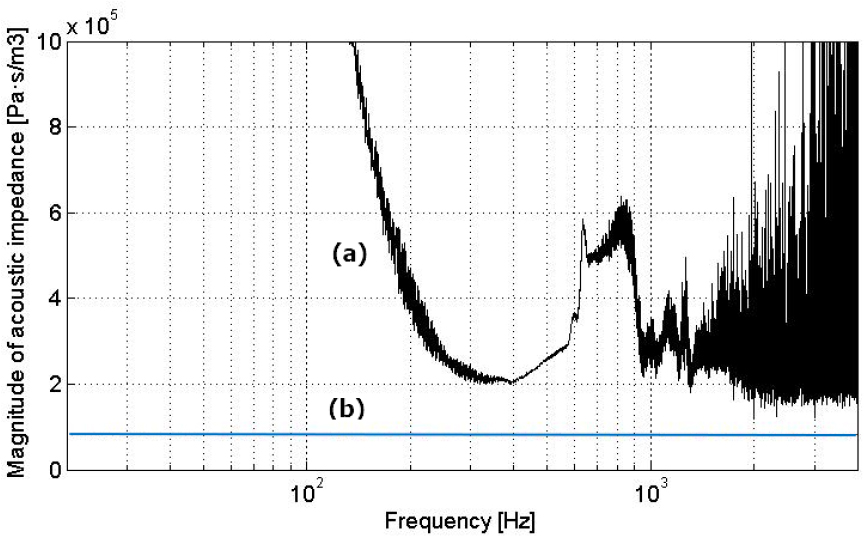
Fig. 8 shows the sound absorption coefficient measured by the proposed method. It is surprising that even for low frequencies below 100 Hz, a very smooth curve has been obtained, which highlights that the sound absorption coefficient at the very low frequency ranges, which has been difficult to obtain using the conventional techniques, can be obtained with this method.
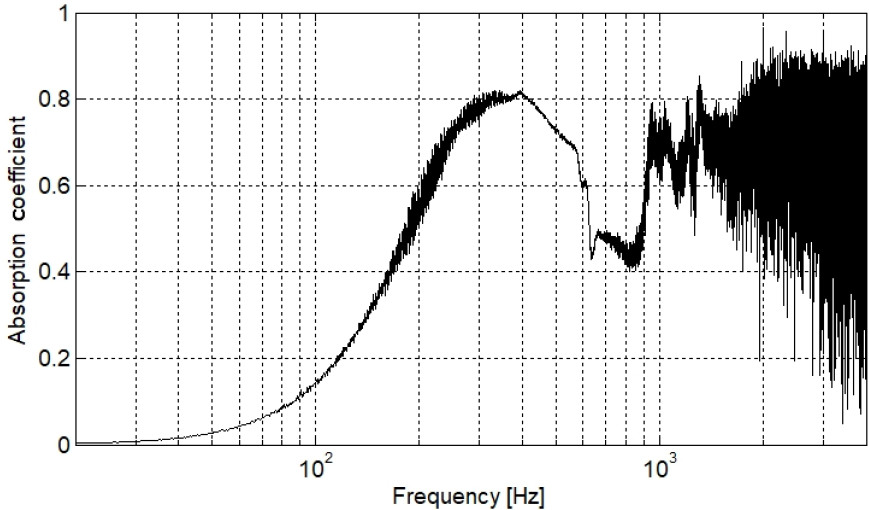
Fig. 8.
Sound absorption coefficient obtained by the proposed method with the same specimen of Fig. 1.
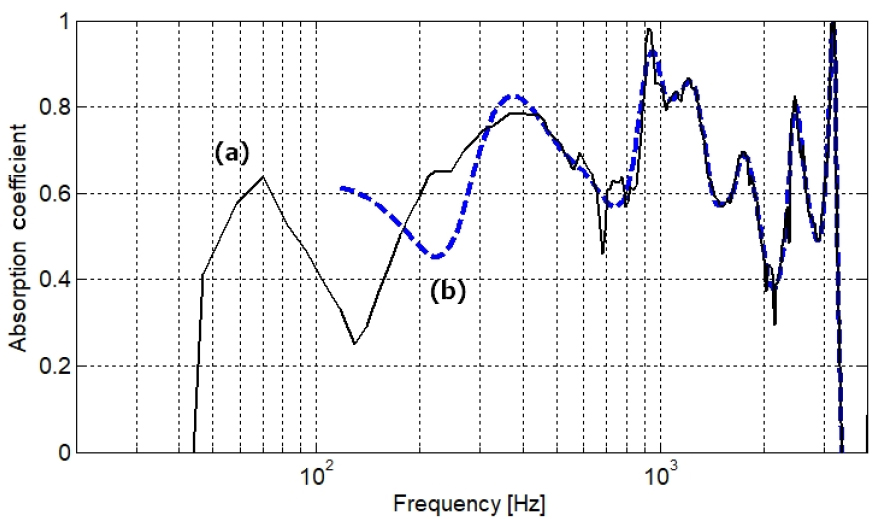
For comparison, the sound absorption coefficient has also been measured by the transfer function method utilizing the same specimen. The diameter of the impedance tube was 48 mm maintaining the plane wave up to 3 kHz, and the spacing between the two microphone was 50 mm. Fig. 9 shows the sound absorption coefficients obtained by the FFT of the impulse response between the loudspeaker and the microphones with two different window lengths (70 msec, 9 msec). Above 400 Hz, the two windows resulted in similar graphs, but in the low frequency band below 400 Hz, very dissimilar graphs were obtained, indicating that it is difficult to trust the data in those low frequency ranges. Uncertainty of the transfer function method using 2 microphones is very large in the low frequency band. In addition, short windowing of 9 msec which uses only one reflection from the specimen did not calculate below 110 Hz.
In summary, it can be confirmed that the method of measuring the sound absorption coefficient by measuring the loudspeaker impedance can be an excellent method for measuring the sound absorption coefficient in the low frequency ranges.
IV. Conclusions
Measurement of the acoustic impedance or sound absorption coefficient of a material is very important to guarantee the acoustic performance of a building. ISO354 international standard costs too much and its sound absorption coefficient could be unrealistic due to the influence of the edge of the specimen. ISO10534-2 has weaknesses that it is valid only for normal incidence and that it is difficult to trust at low frequencies with a comparably short tube.
In this study, a new method has been proposed which can measure the acoustic impedance or the sound absorption coefficient only by measuring the loudspeaker impedance without the need for any microphones. The advantages of this method are as follows:
1) No need for a microphone or long tube.
2) It measures the surface acoustic condition of the specimen instead of measuring the traveling normal incidence with reflection.
3) Measurement at low frequencies that were previously impossible or unreliable is possible.
This method, however, has the following limitations:
1) For reliable results, it is necessary to extract very accurate T/S parameters of the loudspeaker.
2) It is valid only for frequencies below the breakup vibration of the loudspeaker.
As for the applications, since this measurement method is simple to use and portable, it can be easily applied for an in-situ measurement.
