

I. Introduction
II. Proposed Octave-Band Order Statistics
2.1 Spectral Subband Order Statistics
2.2 Segment-Level Aggregation of Spectral Features
III. Experimental Results
IV. Conclusions
I. Introduction
With the huge volume of digital music available for browsing, retrieval, and indexing, there is a strong need to efficiently retrieve music information automatically. Among various metadata of music content for music information retrieval, such as genre, tempo, chord, instrumentation, style, mood, singer, and composer, the musical genre is the most popular music descriptor. Since the manual annotation of music metadata is time-consuming and tedious, automatic classification of musical genre based on its features has received increased attention.[1-3]
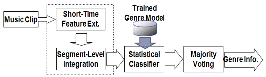
As shown in Fig. 1, most of the musical genre classifiers generally consist of four steps: short-time feature extraction, segment-level integration, statistical classifier, and majority voting. Short-time features relevant to genre classification are extracted from a frame (typically between 20 and 100 ms). Since a frame does not contain enough information for genre classification, the short-time low-level spectral features are integrated, on a longer duration (several seconds or full song), into a segment-level feature to incorporate the temporal music characteristics. Although various integration methods have been studied,[4] the mean and the standard deviation of the short-time feature vectors in a segment is the most widely employed. Any kind of state-of-the-art statistical classifiers, such as nearest neighbor, Gaussian mixture model, and support vector machine (SVM), can be used in training the genre model over the segment-level feature. In this paper, the linear SVM classifier, known for its simplicity and reasonably high classification accuracy, is used. As a final step, the classification results from all segments in a music clip are aggregated typically by the majority voting rule.
Most of the previous works in musical genre classi-fication are based on the short-time spectral descriptors which are related to the timbral texture of a music signal. Among various spectral descriptors,[1,5] the mel-frequency cepstral coefficients (MFCC) and the octave-band spectral contrast (OSC)[6] have shown notable classification accuracy. The MFCC depicts the smoothed spectral shape of a frame and has been the most-widely used feature for speech recognition and audio signal analysis. The OSC was first proposed solely for musical genre classification and describes the difference between the maximum and the minimum of the power spectrum at the octave-scale subbands. As an extension to OSC, this paper investigates different types of the spectral distributional characteristics of the octave-scale subbands. In particular, we propose a musical genre classification method based on the octave- band order statistics, such as the median, quartile, minimum, maximum, and so on. The order statistics clearly contain critical information of the relative distribution of the harmonic and non-harmonic components of music signal. The OSC utilizes the octave-band order statistics in the form of the octave-band spectral contrast and showed that the relative disposition of the spectral information is relevant in classifying musical genre. However, the previous work[6] is a limited study only using the minimum and the maximum of the spectral distribution. In this paper, we extend the previous work and generalize it to the more descriptive form of order statistics. We utilize the order statistics in extracting the low-level spectral features as well as integrating them into the segment-level feature. Compared with the previous works,[2,5] the octave-band order statistics of spectral distribution achieved comparable or better classification performance in experiments.
II. Proposed Octave-Band Order Statistics
2.1 Spectral Subband Order Statistics
The short-time spectral features in the proposed method are based on the distributional characteristics of the octave- scale subbands. According to the results in the paper,[6] the octave-scale subbands contain enough information for dis-tinguishing the genres of a music signal. As in the previous work,[6] we use six octave-scale subbands: 0~200, 200~400, 400~800, 800~1600, 1600~3200, and 3200~6400 (all in Hz unit). The octave-scale bandwidths are wider than the widely used mel-scale bandwidths. We denote the short- time power spectrum of a music signal of the b-th subband as Xb = {Xb[1], Xb[2], ..., Xb[Nb ]} where Nb is the number of frequency bins in the b-th subband. In order to represent the relative disposition of the harmonic and non-harmonic components, we utilize the octave-band order statistics of power spectral distribution. If tonal components prevail in an octave-scale subband, the distributional shape of the subband spectrum Xb will be skewed, which can be easily captured by maximum, minimum, or quartile values of Xb. To extract the order statistics, the short-time spectrum Xb is sorted in descending order. The sorted spectrum is denoted by X'b = {X'b[1], X'b[2], ..., X'b[Nb ]}. The order statistics of the spectral distribution of Xb can be represented in a number of ways, such as median, quartile, maximum, minimum, and so on. Especially we study the ordinal descriptive statistics of the spectral distribution often represented by the set of percentiles. The five widely used ordinal summary statistics are chosen in Table 1. Each set of the percentiles is denoted by the spectral octave-band order statistics (SOS). The maximum and minimum is denoted by SOS1. We note that we use 5 and 95th percentiles as the minimum and the maximum respectively to mitigate the effects of outliers. The upper and lower quartile is denoted by SOS2. The median, maximum, and minimum is denoted by SOS3. The median and two quartiles is denoted by SOS4. The maximum, minimum, median, and two quartiles is denoted by SOS5. Using more percentiles could make the summary statistics more descriptive, however in practice adding more percentiles than SOS5 was not highly effective (only improving classification performance marginally). The most important five-number ordinal summary statistics in SOS5 was enough to provide the state-of-the-art musical genre classification accuracy. Rather than directly using the percentiles of Xb , it is noted that we take the logarithm on the values of the percentiles as in (1) and (2), which has shown better classification performance in practice.
As a comparison to the proposed method, we note that the previous work[6], called OSC, utilizes a robust statistic version of the maximum and the minimum, which are termed as spectral peak Pb and valley Vb of the b-th subband as follows:
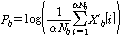 ,
,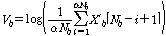 ,
,where α is the neighborhood factor (typically set between 0.02 and 0.2). The spectral contrast is given by the difference between the spectral peak and the valley. The spectral contrast and the spectral valley was used in classifying musical genre in.[6] The spectral contrast is also known to be important for vowel identification to cochlear implant listeners.[7] Among numerous order statistics, the OSC utilizes only the maximum and the minimum while the proposed SOS considers various percentiles of the spectral subband distribution.
2.2 Segment-Level Aggregation of Spectral Features
In musical genre classification, each segment of a music signal (typically between 1 and 30 s) is regarded as an independent information source for the final genre decision as shown in Fig 1. Majority voting rule is typically used in combining the classification result of each segment. Since a segment is composed of scores or hundreds of frames, we need to integrate the frame-level features into a segment- level feature. The mean and the standard deviation of the frame-level features in a segment are widely-used as a segment-level feature for most of the previous works. In this paper, we also extend the previous temporal integration methods, the mean and the standard deviation, into the order statistics. We apply the same types of the summary order statistics in Table 1 to temporal integration of frame- level features. We denote them as the temporal order statistics (TOS). The maximum and minimum of frame- level features is denoted by TOS1. The upper and lower quartile of frame-level features is denoted by TOS2. The median, maximum, and minimum of frame-level features is denoted by TOS3. The median and two quartiles of frame-level features is denoted by TOS4. The maximum, minimum, median, and two quartiles of frame-level features is denoted by TOS5.
III. Experimental Results
The genre-classification accuracy of the octave-band order statistics was evaluated on the two widely used music datasets. The first music dataset (abbreviated as ISMIR2004) is the one from the ISMIR 2004 genre classification contest in which there are 1458 songs over the six different types of genres: classical, electronic, jazz_blues, metal_punk, rock_pop, and world. The second music dataset (abbreviated as GTZAN) is the one that was used by George Tzanetakis in his work.[1] It consists of 1000 songs over ten different genres: blues, classical, country, disco, hiphop, jazz, metal, pop, reggae, and rock. For the ISMIR2004 dataset, one half of the songs was used for training, and the other half was used for testing. For the GTZAN dataset, the 10 fold cross-validation was used to get the classification accuracy. Each song in the dataset was converted to mono at a sampling frequency of 22050 Hz and then divided into frames of 46.4 ms overlapped by 23.2 ms. We computed the octave-band order statistical features. The extracted short-time features were temporally integrated over six seconds. Then the linear SVM classifier was trained and tested in classifying a segment-level feature. The genre of each music clip was determined by the majority voting on the classification results of the segments in the clip.
The classification results of the ISMIR2004 and GTZAN datasets are given in Table 2 and 3 respectively. The set of octave-band order statistics, SOS1, SOS2, SOS3, SOS4, and SOS5, in Table 1 was used in combination with the temporal integration methods, TOS1, TOS2, TOS3, TOS4, and TOS5. For a comparison with the previous spectral descriptors, the 12-order MFCC and the OSC were included in the test. To compare temporal integration methods, the temporal mean and standard deviation (abbreviated as TMS) was included in the test. The results of them are also listed in Tables 2 and 3. The best classification accuracy for the ISMIR2004 dataset was 84.5 % which was achieved by the combination of both SOS3 and TOS5 and SOS5 and TOS3. The best classification accuracy for the GTZAN dataset was 87.1 % which was achieved by the combination of SOS5 and TOS5. As a practical point of view, the SOS3 and TOS3 were quite effective with a moderate feature dimensionality. For the spectral order statistics, the SOS1 and SOS2 showed similar performance to the other spectral features, MFCC and OSC. In the temporal integration, the order statistics, TOS1 and TOS2, which have the same dimensionality with the TMS, showed similar performance with TMS. Higher-dimensional order statistics, TOS3, TOS4, and TOS5, greatly improved the classification accuracy over the TMS. Especially for the GTZAN dataset, which has more types of genres to classify, the higher-dimensional spectral and temporal order statistics are more effective. For both the spectral and the temporal order statistics, the maximum and the minimum (the 5th and 95th percentiles) performed somewhat better than the two quartiles (the 25th and 75th percentiles). As we add more percentiles, the classification accuracy was improved. However, adding more percentiles over SOS5 and TOS5 was not quite conducive in improving the classification accuracy. In general, raising feature dimensionality, by adding non- redundant features, improves the classification accuracy while increasing computational complexity, which is also noticeable in the Table 2 and 3. The computational cost involved in extracting the feature vector is another important issue in practice. The proposed order statistics, which require sorting and linear interpolation in computing percentiles, are computationally efficient compared with MFCC, which needs DCT computation over melspectrum, and TMS, which needs standard deviation computation.
The classification accuracy of the proposed method was compared with that of the recent literatures[2,8-9] on the same two music datasets. Even testing on the same datasets, it is not easy to compare the performance of the previous works directly since the experimental settings in those papers were fairly different, such as the dimension of the feature vectors and the type of classifiers and so on. Thus, the comparison presented in this paper should not be considered as conclusive. Benchmark study with careful setting is needed to lead to any conclusion. When we limit the baseline classifier as the linear SVM, which was used in this paper, the best classification accuracies reported for ISMIR2004 dataset are 75.2 %[2], 84.6 %[8], and 84.8 %[9], and those for GTZAN dataset are 78.5 %[2], 84.9 %[8], and 84 %[9]. We note that it is reported in[2,9] if they use the SVM with RBF kernel, the classification accuracy can be improved further about 5 %. Since an extensive benchmark testing is not the aim of this paper, we focus on showing the validity of using the octave-band order statistics on the musical genre classification task. By using the SOS5 and TOS5, the classification accuracy of the proposed method exceeded 84 % on both datasets in Tables 2 and 3, which is among the best results reported so far with the linear SVM classifier, although the proposed method is less complicated than the other approaches compared with.[2,8-9] The results of the presented work, along with the results of,[6,8] show that the relatively more sophisticated mel-scale subband, which is known to be effective for speech recognition, might not be the best choice for the musical genre classification task. The octave scale, which is wider than the mel scale, might be the better choice for music signal analysis, which calls for further verification studies on other musical tasks.
IV. Conclusions
For musical genre classification, the performance of the octave-band order statistics was tested. The order statistics are utilized in extracting the low-level spectral features over octave-scale subbands as well as integrating them into the segment-level features. The performance of the proposed method was experimentally compared with that of the MFCC and OSC on both the ISMIR2004 and the GTZAN datasets. The performance gain obtained by using the octave-band order statistics over the MFCC and OSC was 2.61 % for ISMIR2004 and 8.9 % for GTZAN.
