

I. Introduction
In underwater acoustic communication system, multipath fading is an important consideration, particularly in shallow water environments.[1-3] Firstly, the multipath delay spread can cause inter-symbol interference (ISI) if the symbol rate increases for high speed communication.Secondly, the transmitter or receiver motion and sea surface fluctuations can result in Doppler spread and signal amplitude fading which can lead to an incorrect symbol decoding. Thirdly, the multipath arrivals from various paths interfere with each other and cause constructive and destructive interference in received signals which results in significant fluctuations in signal-to-noise ratio (SNR). All the resultant ISI, amplitude fading, and interference occur simultaneously in high speed communication. Furthermore, medium properties such as salinity and temperature change with time. Therefore multipath propagation delay changes with time. All of these factors can result in frequency and surface fluctuation dependent multipath fading.[4,5]
The frequency shift keying (FSK) system is known to be less sensitive to the fading channel and more robust to combat the effects of time-varying shallow water in frequency non-selective multipath fading channel.[6-10] However, the FSK signaling scheme has a disadvantage owing to its low speed data rate. M-ary frequency shift keying (MFSK) is adopted to increase a data rate for a single user.[11]
The Reed-Solomon (RS) code is a non-binary forward error correction code and effective to reduce errors such as in deep fading channels which induces burst error. The RS code is generally specified by three parameters (n, k, t), where n is the block code length, k is the length of information symbols and t is the length of error correcting symbols. n-k and t = (n-k)/2 are the measure of redundancy in the block and the number of correctable symbols, respectively.[12,13] A quadrature phase shift keying (QPSK) with a convolution (2,1,3) and RS code (7,3,2) has been examined and it has been found that the latter code shows the better performance in multipath fading channel.However, frequency dependent multipath fading effect on the performance is not conclusive.[14-16]
In this paper, we consider 4 channels MFSK (M = 4) system with and without RS code in shallow sea multipath fading channel. Experimental results show how the frequency dependent time-varying underwater acoustic multipath fading channel affects the bit error rate (BER) of MFSK communication system with RS code.
II. Experimental procedure
The experiment was conducted in about 16 m depth ocean near Geoje island in Korea on OCT. 17, 2015. The experimental configuration and parameters are shown in Fig. 1 and Table 1. Fig. 2 shows the typical sea surface photograph with 20 cm diameter plastic buoy. The ranges between the transmitter (Tx) and the receiver (Rx) are set to be about 100 and 400 m. The depth of Tx and Rx are set to be 9 and 7 m, respectively. In both ranges, the Tx and Rx are fixed to avoid Doppler spread by their motion.


Fig. 3 shows the segmented Lena image allocated to each channel which has a set of 4FSK orthogonal frequencies. The orthogonal frequency spacing is given by 1/T (T: symbol period) and all four channel signals are transmitted simultaneously. Frequency guard-band between channels is inserted by 1/T to reduce inter-channel interference. To minimize an effect of time variant underwater channel and characterize the frequency dependent multipath fading effect on 4FSK system, each frame which consists of a synchronization and information signal, is limited as a length of 1s.

Table 2 shows orthogonal frequency groups for each data rate. Transmitting frequency covers from 14 to 21.2 kHz.
In order to estimate channel impulse response and frequency response (channel coherence bandwidth), a linear frequency modulated (LFM) signal of 13 to 23 kHz bandwidth was transmitted before information signal transmitting. The LFM signals were also used to get symbol synchronization and interference and frequency selective fading patterns.
III. Results and discussion
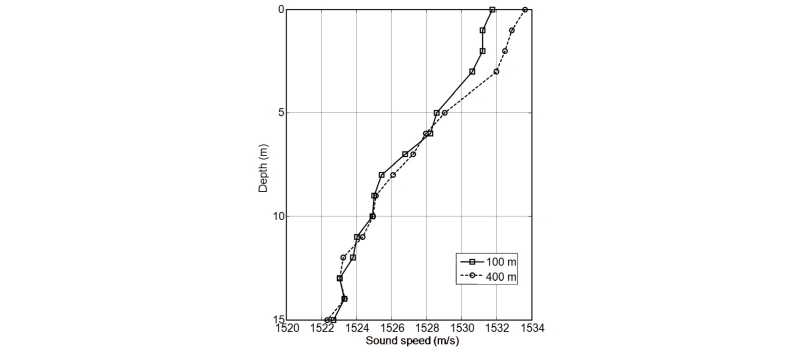
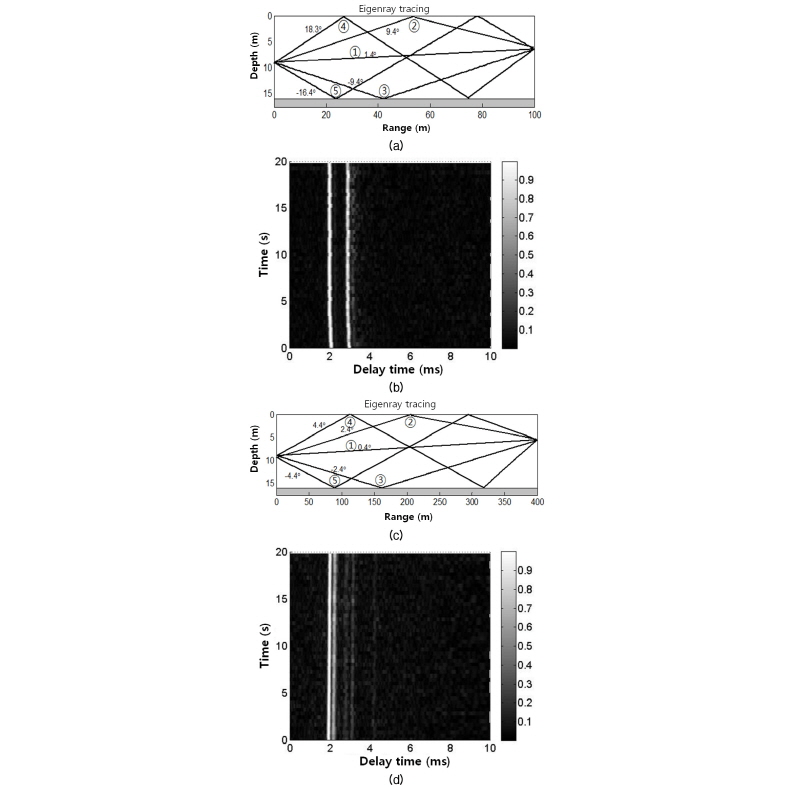
Fig. 4 shows the sound velocity profile. The channel impulse response was analyzed by multipath intensity profile (MIP) which is given by matched filtering the received LFM signal with the transmitted LFM signal. Fig. 5 shows the eigenray trace and the MIPs of 100 and 400 m Tx-Rx ranges, respectively. In Fig. 5(a) and (c), the numerical value of each eigenray means the first bounce grazing angle of a multipath with respect to the boundary plane. The angle of the direct path is measured in the horizontal direction. Only the arrival paths with the five highest that may show high signal amplitudes are shown. Table 3 shows the relative time delay (ms) and grazing angle of each eigenray at 100 and 400 m source-to-receiver ranges. Comparing the relative delay time of each eigenray in Table 3 to MIPs in Fig. 5(b) and (d), only first three eigenrays are observed at 100 m but five eigenrays at 400 m. The first strong signal of direct path is pretty stable in both cases. Owing to high intensity with low grazing angle, more path signals are observed in 400 m range. The fourth and fifth eigenrays are not observed at 100 m but additional eigenray with relative delay time of about 2 ms is observed at 400 m.
|
Fig. 5. Eigenray traces and multipath intensity profiles (MIPs): (a) eigenray trace of 100 m, (b) MIP of 100 m, (c) eigenray trace of 400 m, and (d) MIP of 400 m. |
The channel frequency response spectra for both MIPs in Fig. 5 are shown in Fig. 6. In Fig. 6 it shows one side spectra and -3 dB bandwidths are about 60 and 72.5 Hz in 100 and 400 m ranges, respectively. Based on this result, channel coherence bandwidths at 100 and 400 m are considered as 120 and 145 Hz, respectively.

The signal bandwidth of 4FSK is about one fourth of data rate. Therefore 400 bps signal satisfy frequency non selective channels at 100 and 400 m but the 1600 bps signals not at both ranges. In theory, the signal of 400 bps data rate will be received without ISI and no error condition under high SNR. But in practice this is insufficient for no error condition owing to frequency dependent multipath fading and it will be explained below in Fig. 8 and Table 4.
Fig. 7 shows normalized receiving signal spectra of LFM signal at both Tx-Rx ranges. Frequency responses of LFM signal, hydrophone (B & K 8106) and power amplifier (B & K 2713) are flat in frequency band of 13 to 23 kHz. However, the envelope of overall level of the spectrum in Fig. 7 is weighted as to the source transducer frequency and shows the maximum level at about 17 kHz which is the resonant frequency of transducer (ITC 1001). The multipath interference or fading depends on frequency and Tx-Rx range. The dip and the maxima in spectra correspond to destructive and constructive multipath interference fre-quencies. Interference pattern of 400 m is more complicate that that of 100 m owing to the more multi-paths. The level difference between dip and maxima reaches up to more than 6 dB. Therefore, if carrier frequency locates in construc-tive frequency, then signal energy is more than 6 dB higher to destructive frequency resulting in the higher SNR.
| ||
Fig. 7. Normalized spectra of received LFM signal in 100 and 400 m Tx-Rx ranges: (a) 100 m, (b) 400 m (frequency groups of 4 CHs of 400 bps). |
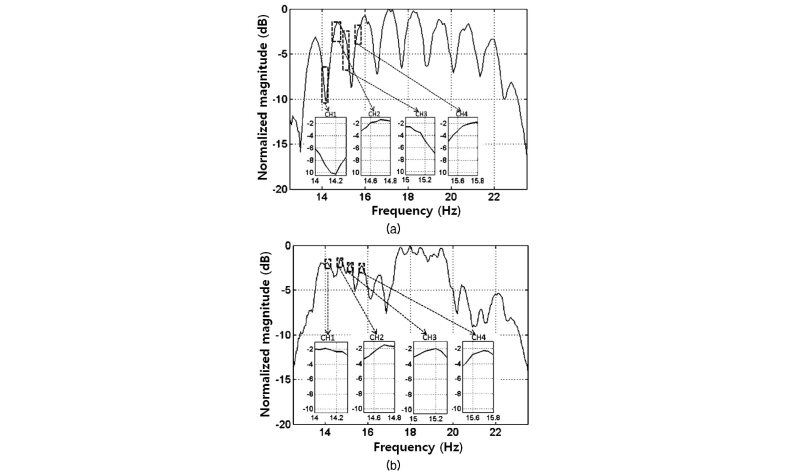
Table 4. Received image of each channel and BERs without RS code (Data bits: 20000). | ||
4CH-4FSK | 400 bps | 1600 bps |
100 m |
|
|
Error number | 1185/20000 | 2353/20000 |
BER | 0.06 | 0.12 |
400 m |
|
|
Error number | 0/20000 | 1072/20000 |
BER | 0 | × 0.05 |


|
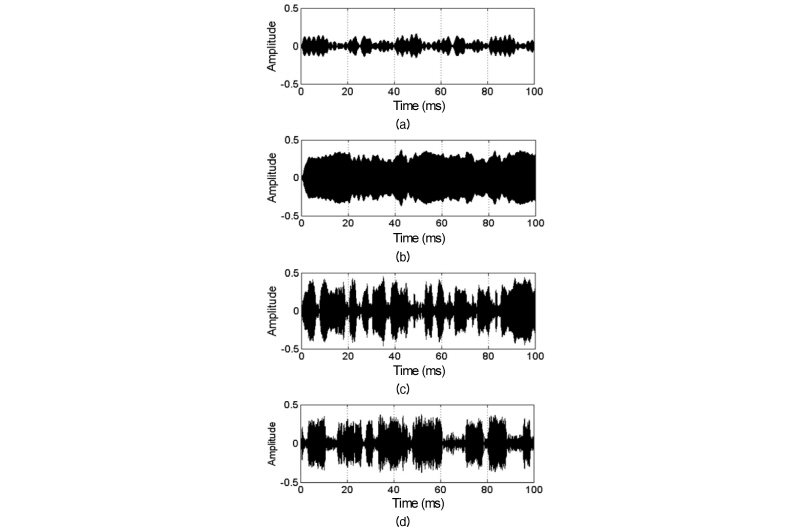
Fig. 8. Received signals waveforms at 100 m: (a) CH1/400 bps, (b) CH2/400 bps, (c) CH1/1600 bps, (d) CH2/1600 bps. |
The frequency groups of 4 CHs of 400 bps are designated as shown in Fig. 7 for both ranges. At 100 m, frequency groups of CH1 (14-14.3 kHz) and CH3 (15-15.3 kHz) at 100 m are in destructive frequency but CH2 (14.5-14.8 kHz) and CH4 (15.5-15.8 kHz) in constructive frequency region. At 400 m, frequency groups of all 4 channels are in constructive frequency region.
Table 4 shows the received images and BERs without RS code of two different data rates at 100 and 400 m Tx-Rx ranges.
At 100 m and 400 bps, the errors occur in CH1 and CH3 since corresponding carrier frequencies are in the destructive or the lower SNR frequency region as shown in Fig. 7. The symbol energy level of CH1 is the lowest which is as low as -10 dB to CH2, so CH1 shows the most errors. Figs. 8(a) and (b) show the received symbol signal waveforms of CH1 and CH2. The signal level of CH1 is lower than that of CH2 since the carrier frequencies of CH1 and CH2 are in destructive and constructive interference region, respectively. Fading is observed in both channel signal envelopes with time owing to sea surface fluctuation even if the channel is flat.
At 100 m and 1600 bps, the channels are frequency selective. The errors occur randomly as shown in image of each channel. Fig. 8(c) and (d) show the received symbol signal waveforms of CH1 and CH2. Both channel signals exhibit large variation because of both ISI and frequency dependent constructive or destructive interference. The four orthogonal frequencies of each channel have a chance to meet a dip frequency to give the lower SNR. Fading is also observed in both channel signal envelopes with time but its magnitude is larger than that at 400 bps since fading is due to sea surface fluctuation, ISI, and frequency dependent interference.
At 400 m, the bit errors of 400 and 1600 bps are less than those at 100 m, since the frequency selectivities of channels at 400 m less than those at 100 m.
In conclusion, the bit error depends on frequency selectivity or ISI, frequency dependent interference, and sea surface fluctuation. A random error correcting code may be effective in frequency non selective and relatively calm sea state channel in which fading magnitude is small. However, a burst error correcting code will be more effective since fading magnitude will become large in frequency selective, rough sea state, and frequency dependent interference channel. Therefore, non-binary code such as RS code corrects efficiently these burst errors in frequency dependent multipath fading channel.
Table 5 shows the received images and BERs using RS code (7,3,2). Comparing to the results in Table 3, the BERs were reduced at least one third in both ranges and both data rates. The 400 bps errors of CH1 and CH3 at 100 m which are due to the destructive interference, are reduced by adopting non binary RS code. The 1600 bps errors are also reduced and RS code may correct the burst errors in deep fading region as shown in Fig. 8(c) and (d). Therefore the RS code is very useful to resist frequency dependent multipath fading and ISI.


IV. Conclusions
Four channel 4FSK system for two different data rates was examined at two Tx-Rx ranges in time varying shallow water multipath channel. The frequency dependent multipath fading channel is characterized on basis of channel impulse response, coherence bandwidth, frequency dependent interference and signal waveform. The bit error of a different data rate or different Tx-Rx range depends on not only the channel coherent bandwidth but also frequency dependent multipath fading. Non binary RS error correcting code is adopted since the errors occur as burst in frequency selective, rough sea state, and frequency dependent interference channel. Bit error rate is reduced at least one third by adopting RS code.
