

I. Introduction
II. Feasibility test of an ultrasonic waveguide
2.1 Working principle
2.2 Feasibility test
III. Design of an ultrasonic waveguide
3.1 Finite element analysis
3.2 Experiments
IV. Conclusion
I. Introduction
Ultrasound has been widely used in industries such as cleaning, medical sensors, and manufacturing areas. Recent researches about ultrasonic aided processes such as bonding, welding, and hot embossing, are reported.[1,2,3] As a compact ultrasound transducer, Ahn et al. developed a piezoelectric Micro-machined Ultrasonic Transducer (pMUT) for wideband ultrasonic radiation in air.[4] On the other hand, one of challenging application areas of ultrasound is the cooling system for industrial applications or microelectronics cooling.[5] Ultrasonic cooling systems can work with air, argon (Ar) and nitrogen (N2) instead of conventional refrigerant such as freon gas, which can cause global warming. Furthermore, ultrasonic systems do not have moving parts compared to compressor type coolers. So high durability can be obtained.[5]
For understanding the thermal phenomenon of the focused ultrasound, Kim et al.[6] reported the research about the visualization of temperature in mixed acoustic mediums. Ultrasonic cooling uses ultrasonic wave energy, and a temperature reduction can be obtained from the compression and expansion of the gas by ultrasonic vibration. Previous research has been performed, and the main focus of these studies was exploring methods of increasing passive cooling effect by enhancing the convective heat transfer coefficient.[7,8,9] However, these technologies are passive cooling methods, in which the temperature cannot be lower than the environment temperature.
On the other hand, research on active acoustic cooling systems which can refrigerate the heat sink component to lower than the environment temperature has been carried out elsewhere.[6,10,11,12,13,14] An acoustic cooling system for industrial applications that are operated at an acoustic frequency of 94 Hz was developed by Los Alamos National Lab..[6] Adeff et al. reported a thermoacoustic refrigerator, which uses acoustic waves generated by solar energy.[10] However, the operating frequencies of these systems were in the audible frequency range (20 Hz - 1,000 Hz); hence, the overall sizes ranged from 0.3 m to 1.0 m.
Considering the following equation,
where v is the speed of sound, f is the frequency, λ is the wavelength, λ is inversely proportional to f. The overall system size is dependent on λ; as a consequence, the higher frequency is advantageous for a smaller size.
For these reasons, an ultrasonic cooling system needs to be developed. Some attempts have been made to increase the operation frequency. Symko et al.[15] reported thermoacoustic heat engines for heat management in microcircuits in which the operating frequency range is from 4 to 24 kHz. Flitcroft et al. proposed an ultrasonic thermoacoustic energy converter, which can be operated at frequencies up to 23 kHz. However, these systems involve a thermoacoustic process which needs a process that converts thermal energy to wave generation and wave energy to a cooling process.[16]
In our research, the design and fabrication of an ultrasonic waveguide for cooling microelectronics with feasibility test was performed. To develop the waveguide, finite element analysis using ANSYS software was carried out. First, anti-resonance frequency for a piezoelectric actuator was predicted, and the result was compared with the experimental result. The waveguide was then fabricated, and the impedance characteristics were measured and compared. Next, the predicted anti-resonance frequency for the ultrasonic waveguide was compared with the experimental value. Finally, the application area of the developed ultrasonic waveguide to microchip cooling is discussed.
II. Feasibility test of an ultrasonic waveguide
2.1 Working principle
Many acoustic cooling systems have been developed, in which the operating frequency range is from 20 Hz to 1 kHz, and their design rules have been established well and spread widely.[1] However, an ultrasonic cooler, which can be operated at frequencies up to 40 kHz, has not been developed and attempts to fabricate an ultrasonic cooler remain challenging.
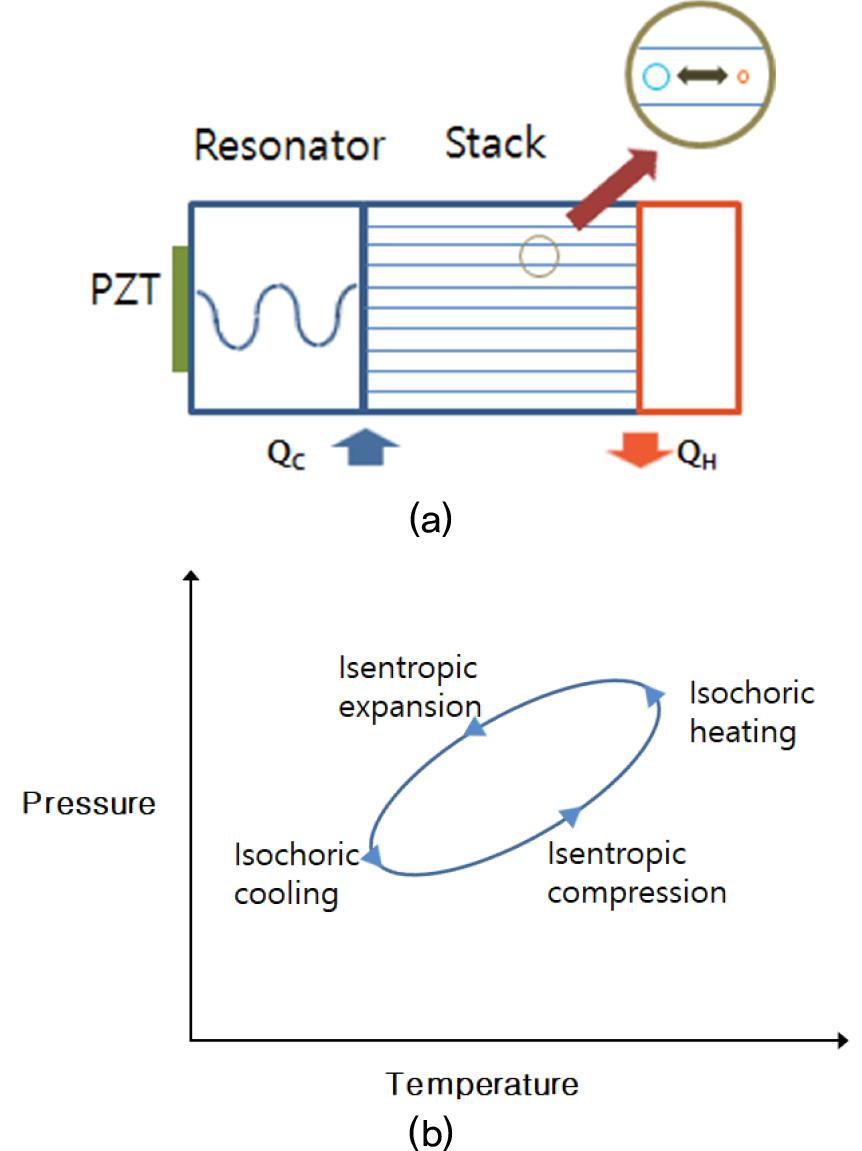
Therefore, we decided to perform a feasibility test firstly, which was designed by using a simple equation (1). The ultrasonic waveguide for cooling consisted of a lead zirconate titanate (PZT) actuator, an aluminum (Al) waveguide, a resonator, and stacks. The schematic of the ultrasonic waveguide with inner structure and working principle is shown in Figs. 1(a) and 1(b). When an ultrasonic wave is sent to the resonator by the PZT actuator, it is transferred through the air inside the resonator. The air inside the stacks oscillates left and right with small displacements forming many thermodynamic cycles as shown in Fig. 1(a). When the air moves to the left, it undergoes isentropic expansion, and subsequently absorbs heat from the heat sink. When moving to the right, the air experiences isentropic compression, resulting in heat rejection to a heat exchanger.
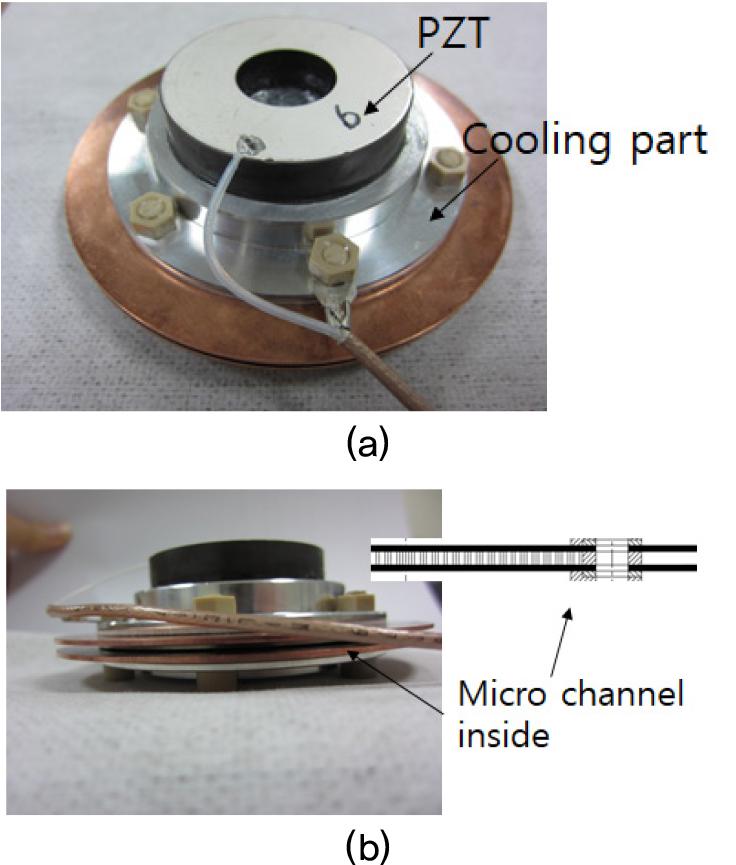
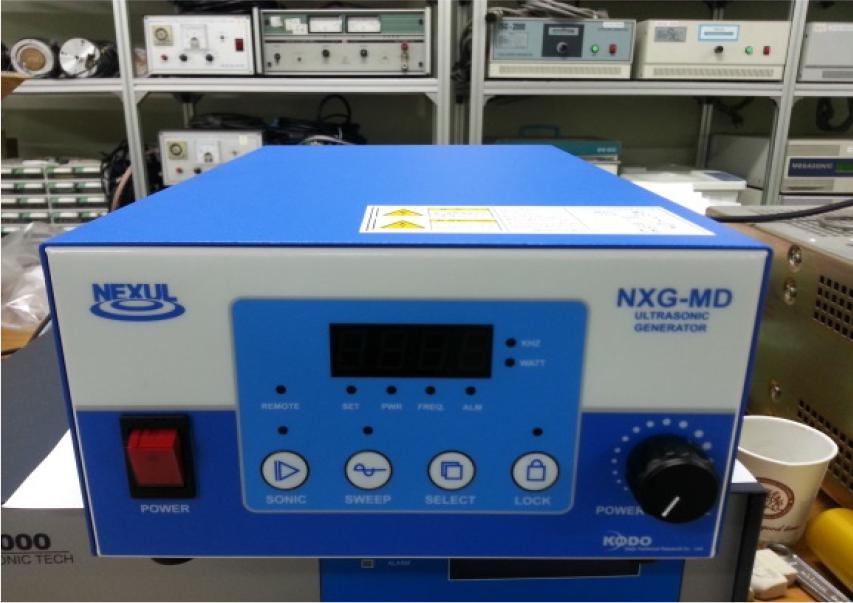
The fabricated ultrasonic waveguide operating simultaneously at an operating power of 40 kHz is shown in Fig. 2(a) and its inner structure is shown in Fig. 2(b). The PZT actuators are attached to the top of the Al waveguide. The role of the waveguide is to transfer displacements from the actuators to a substrate surface. The resonance frequency for the PZT actuators is 40 kHz. The PZT actuator has a ring type structure. For electrical power supply, the ultra- sonic waveguide needs an electric generator connected through an electric wire. The manufactured electric generator is shown in Fig. 3. In the front panel, the main power switch appears on the left side, which can be used to turn the system on and off. On the right side of the front panel, a power control component is provided, which can regulate the power levels. The input power of the electric generator is 220 V and the generator can transmit power with tuned frequencies for 40 kHz PZT actuators.
For the operation of the cooling process, the upper copper (Cu) part of the ultrasonic waveguide is connected to the heat sink. The lower part of the waveguide is a heat exchanger that needs to be connected to a component such as a heat spreader. Therefore, the ultrasonic waveguide can be placed near a heat source, such as a CPU or a microelectronic.
2.2 Feasibility test
For the feasibility test, a simple 20 kHz ultrasonic waveguide cooler was designed as a prototype. First, the wavelength was obtained by using the equation (1), where the speed of sound, VSound, was 340 m/s and the frequency, f, was 20 kHz. The wave length, λ/2 was obtained thus as 8.5 mm. The length of the resonator was 2/3ⅹλ, the value of which is 17.0 mm, the length of the stack was λ/2, and the cover part was λ. The fabricated prototype is shown in Fig. 4. The overall structure is similar to that of the 40 kHz type ultrasonic waveguide cooler. Instead of the PZT actuator, this prototype is attached to the end of the previously fabricated 20 kHz ultrasonic waveguide to obtain vibration.
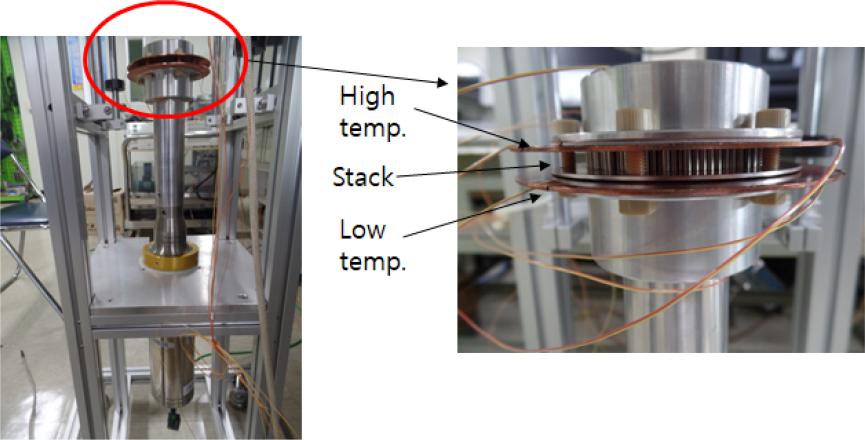
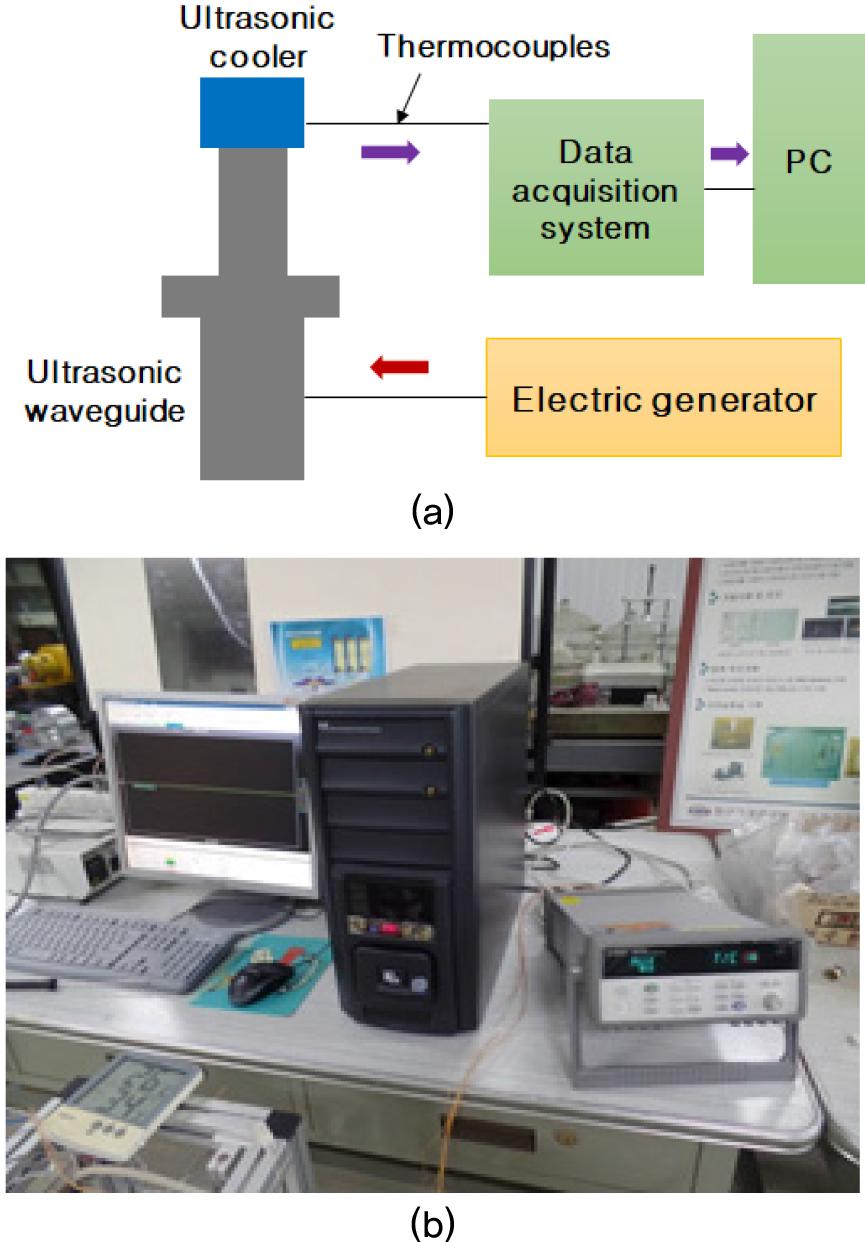
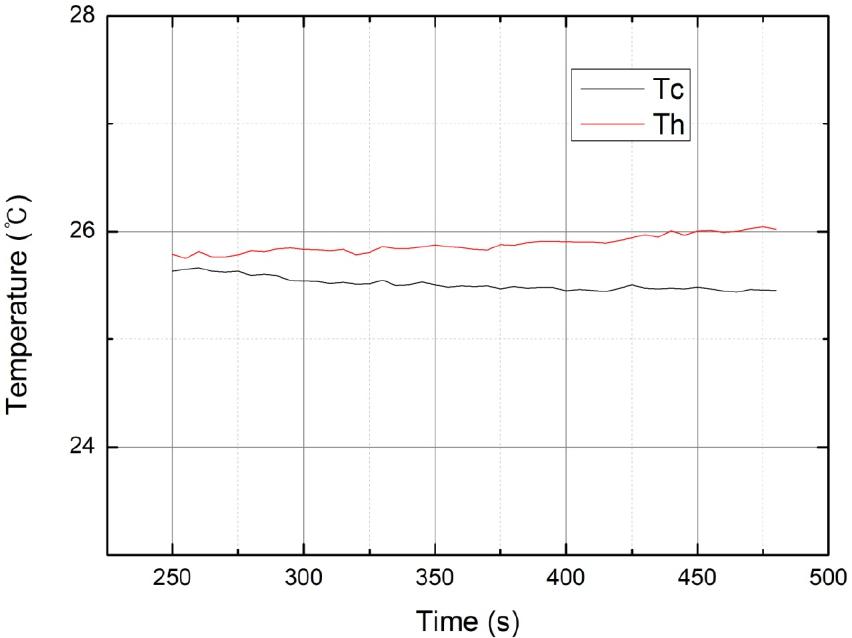
According to the previous cooler structure, the upper Cu component has a high temperature as a heat exchanger and the lower component has a lower temperature as a heat sink. To assess the system performance, temperatures of the hot part Th and the cold part Tc, were measured using the experimental setup shown in Figs. 5(a) and Fig. 5(b). All three points of the Th and Tc were connected by thermocouples, which were connected to the data acquisition system (Agilent 34970A). And the measured values were evaluated and plotted using a Personal Computer (PC). The measured result is shown in Fig. 6. The temperature drop (ΔT) of – 0.5 °C was obtained, where Th was 26.1 °C and Tc, 25.6 °C with the environment temperature of 25.8 °C.
III. Design of an ultrasonic waveguide
Based on the feasibility test, a 40 kHz ultrasonic waveguide for cooling system was designed and fabricated. In this chapter, the design process using the Finite Element Method (FEM) is explained and the fabrication result is shown.
3.1 Finite element analysis
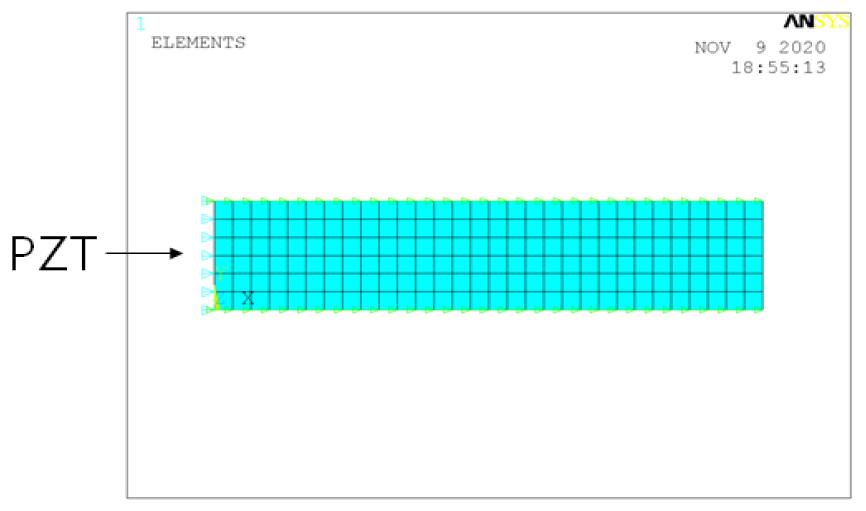
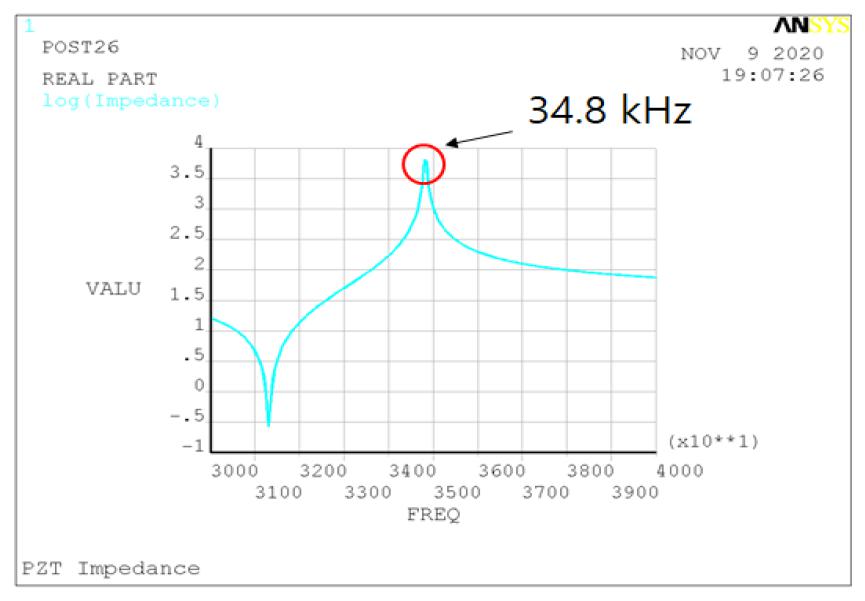
To design the ultrasonic waveguide, FEM analysis using ANSYS (Commercial FEM software) was performed. Firstly, the PZT actuator was modeled with the analysis tool as shown in Fig. 7. For the analysis, it was modeled axis-symmetrically and the nodes of the top and bottom electrodes were coupled to apply voltages. To obtain a solution, a series of calculations were performed from 30.0 kHz to 40.0 kHz. As a result, the highest impedance value was 34.8 kHz, which was selected as the design frequency. The result is shown in Fig. 8. The frequency of the minimum impedance value can be found before the peak. At this point, the current through the PZT is high, thus a large amount of heat is generated. So we used the peak point for the design of the system from now on.
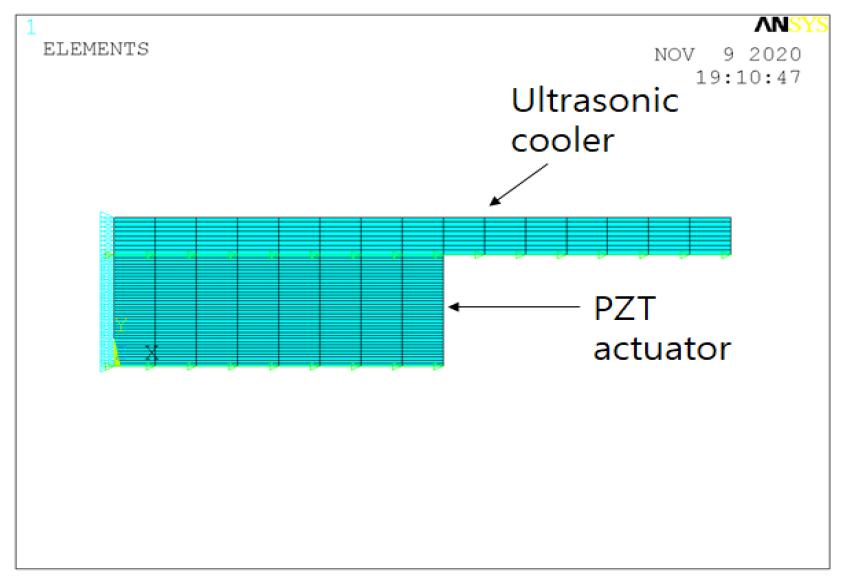
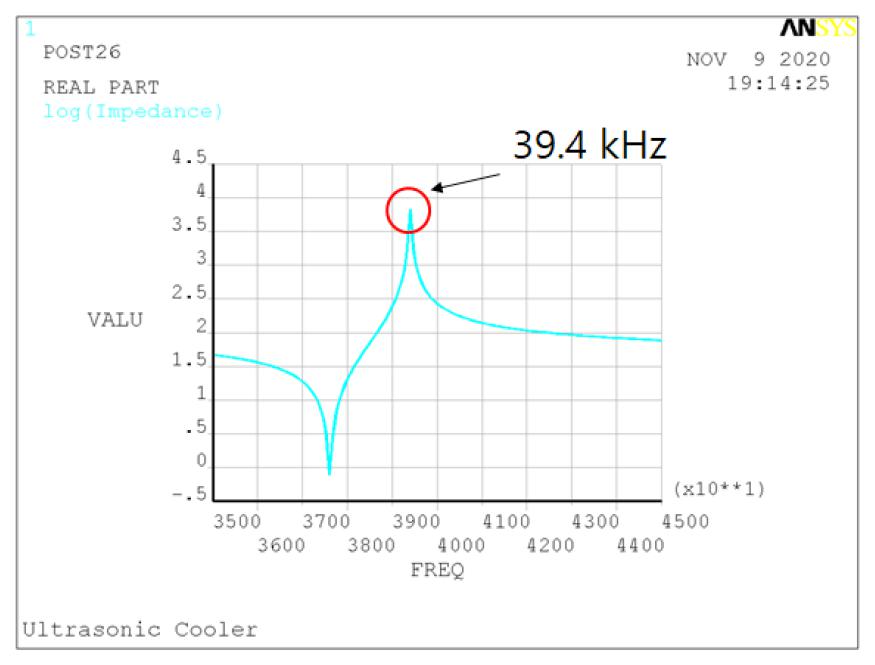
Secondly, the waveguide with the PZT actuator was modeled as shown in Fig. 9. It was also modeled axis- symmetrically and the analysis process was similar. The PZT and the Al waveguide were glued, and the nodes at the interface were merged. A series of calculations was performed from 30.0 kHz to 40.0 kHz. After analysis, the highest impedance value was 39.4 kHz, as shown in Fig. 10.
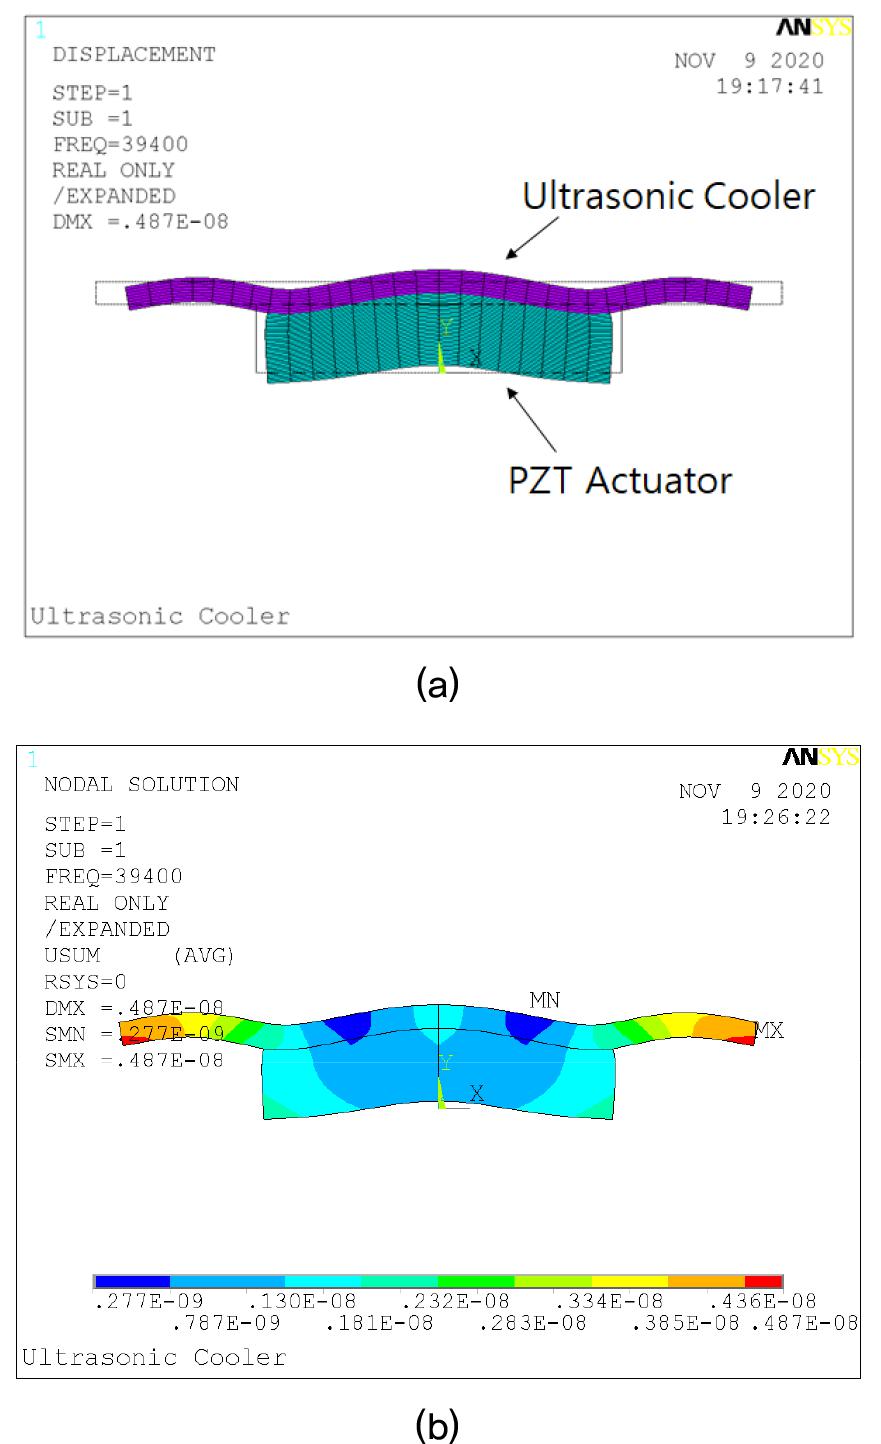
For prediction of the displacement, analysis was performed using the same analysis model as that used for the previous prediction. The PZT actuator and the waveguide were modeled. Modal analysis was then performed and structural motion could then be predicted. From the result, displacement analysis and modal analysis results at the operating frequency of 39.4 kHz, are shown in Figs. 11(a) and 11(b), respectively. The first figure shows an exaggerated displacement result, which illustrates that the center point can show high displacement. Similarly, in the second figure, the red area refers to a higher displacement area, whereas the blue area refers to a lower displacement area. We selected this as a detailed design to obtain dimensions, the result of which shows high displacements at the center.
3.2 Experiments
Based on the FEM analysis results, the ultrasonic waveguide was fabricated. Al was chosen as the material for the waveguide component due to its good machining characteristic. For the operation, the ultrasonic waveguide was tuned with the electric generator for effective working. The power frequency was adjusted precisely to the resonance frequency of the waveguide by using a power meter which is connected to the electric generator.
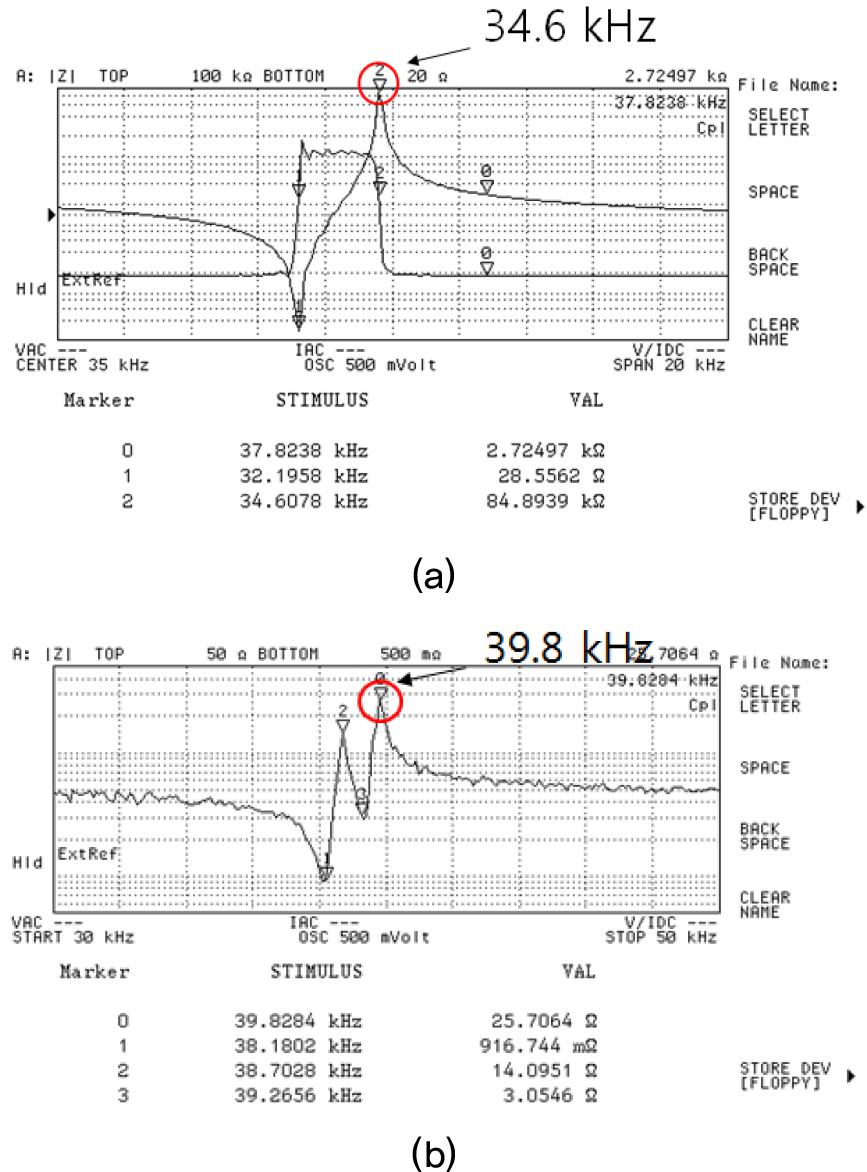
To assess the system performance, impedance characteristics were analyzed using an impedance analyzer (Agilent 4294A). The peak frequency value of impedance was measured as 34.6 kHz of the PZT alone, which agreed well with the predicted value with 0.6 % error, as shown in Fig. 12(a). At this time, the system with the PZT attached was tested. The peak frequency value of impedance was measured as 39.8 kHz, which agreed well with the predicted value with 1.0 % error, as shown in Fig. 12(b).
IV. Conclusion
In this work, the design and fabrication of an ultrasonic waveguide for cooling microelectronics was performed and verified through a feasibility test. When developing this cooling system, the feasibility test of the prototype was performed first. From the result, a temperature drop (ΔT) of - 0.5 °C was obtained, where Th was 26.1 °C and Tc was 25.6 °C (the environment temperature of 25.8 °C).
Based on the feasibility test, the 40 kHz ultrasonic waveguide for the cooling system was designed and fabricated. Finite element analysis using ANSYS software was performed, and anti-resonance frequency for a piezoelectric actuator was predicted. The calculated anti-resonance frequency for a piezoelectric actuator was 34.8 kHz, which was in good agreement with the experimental result of 34.6 kHz with 0.6 % error. The predicted anti-resonance frequency for the ultrasonic waveguide was 39.4 kHz, which agreed well with the experimental value of 39.8 with 1.0 % error. Reflecting these results, the developed ultrasonic waveguide is regarded as being applicable to microchip cooling applications.
