

I. Introduction
The dynamic effects of ultrasound was widely applied not only to traditional fields such as washing, welding, and humidification, but also to high-tech industries such as therapeutic ultrasound, dispersion of functional nanoparticles, and emulsification of nanoscale.[1,2,3,4,5,6,7,8,9,10] In particular, the particle manipulation devices such as ultrasonic tweezer have been developed by utilizing the acoustic radiation force and the acoustic streaming effect, which are the nonlinear phenomenon of ultrasonic waves.[11,12,13,14,15]
Recently, we have proposed an efficient dispersion method for nano particles using the shear force of the vortex. The vortex in a fluid is formed by using the ultrasonic streaming effect caused by multiple ultrasonic beams radiated from arrayed ultrasonic transducers in inner surface of a cylinder.[16] However, since the angle between the radiation surfaces of piezoelectric vibrators for generating vortices has not been sufficiently studied, the design of the shape such as the arrangement of the vibrators is not optimized. Particularly, for designing such an ultrasonic device, it is very important to analyze the distribution of the flow speed depending on the angle between the radiation surfaces of adjacent vibrators and the distance from the sound sources.
In this study, as a basic step, we investigate the change of the acoustic streaming effect generated on the acoustic axis depending on the angle between two piezoelectric vibrators composing an ultrasonic transducer. To measure the flow speed caused by the acoustic streaming, we devise a measurement method using ink droplet with density equivalent to that of water. The measured results are compared with the simulated results.
II. Theoretical model
Due to the nonlinear terms in the Navier-Stokes equations, harmonic perturbation of the flow will lead to a net time-averaged flow called acoustic streaming.[17] Acoustic streaming is a second order (nonlinear) acoustic effect. The time average of acoustic streaming velocity has the following relations from the second-order perturbation theory.[18]
| $$\rho_0\nabla\bullet<{\boldsymbol v}_{\boldsymbol1}>=-\nabla\bullet<\rho_1{\boldsymbol v}_{\boldsymbol1}>,$$ | (1) |
Here, is the second-order pressure. The first-order velocity and pressure are given by the thermodynamic heat transfer equation for temperature , the kinetic continuity equation, and the dynamic Navier- Stokes equation as follows.
| $$\frac{\partial T_1}{\partial t}=D_{th}\nabla^2T_1+\frac{\alpha T_0}{\rho_0C_p}\frac{\partial p_1}{\partial t},$$ | (3) |
| $$\frac{\partial p_1}{\partial t}=\frac1{\gamma\kappa}\left[\alpha\frac{\partial T_1}{\partial t}-\nabla\bullet{\boldsymbol v}_{\boldsymbol1}\right],$$ | (4) |
| $$\rho_0\frac{\partial{\boldsymbol v}_{\boldsymbol1}}{\partial t}=-\nabla p_1+\eta\nabla^2{\boldsymbol v}_{\boldsymbol1}+\beta\eta\nabla\left(\nabla\bullet{\boldsymbol v}_{\boldsymbol1}\right),$$ | (5) |
Here, is the thermal diffusivity, the thermal expansion coefficient, the ratio of specific heats, the compressibility, the dynamic viscosity, the viscosity ratio, and the ambient temperature, respectively.
III. Experiment
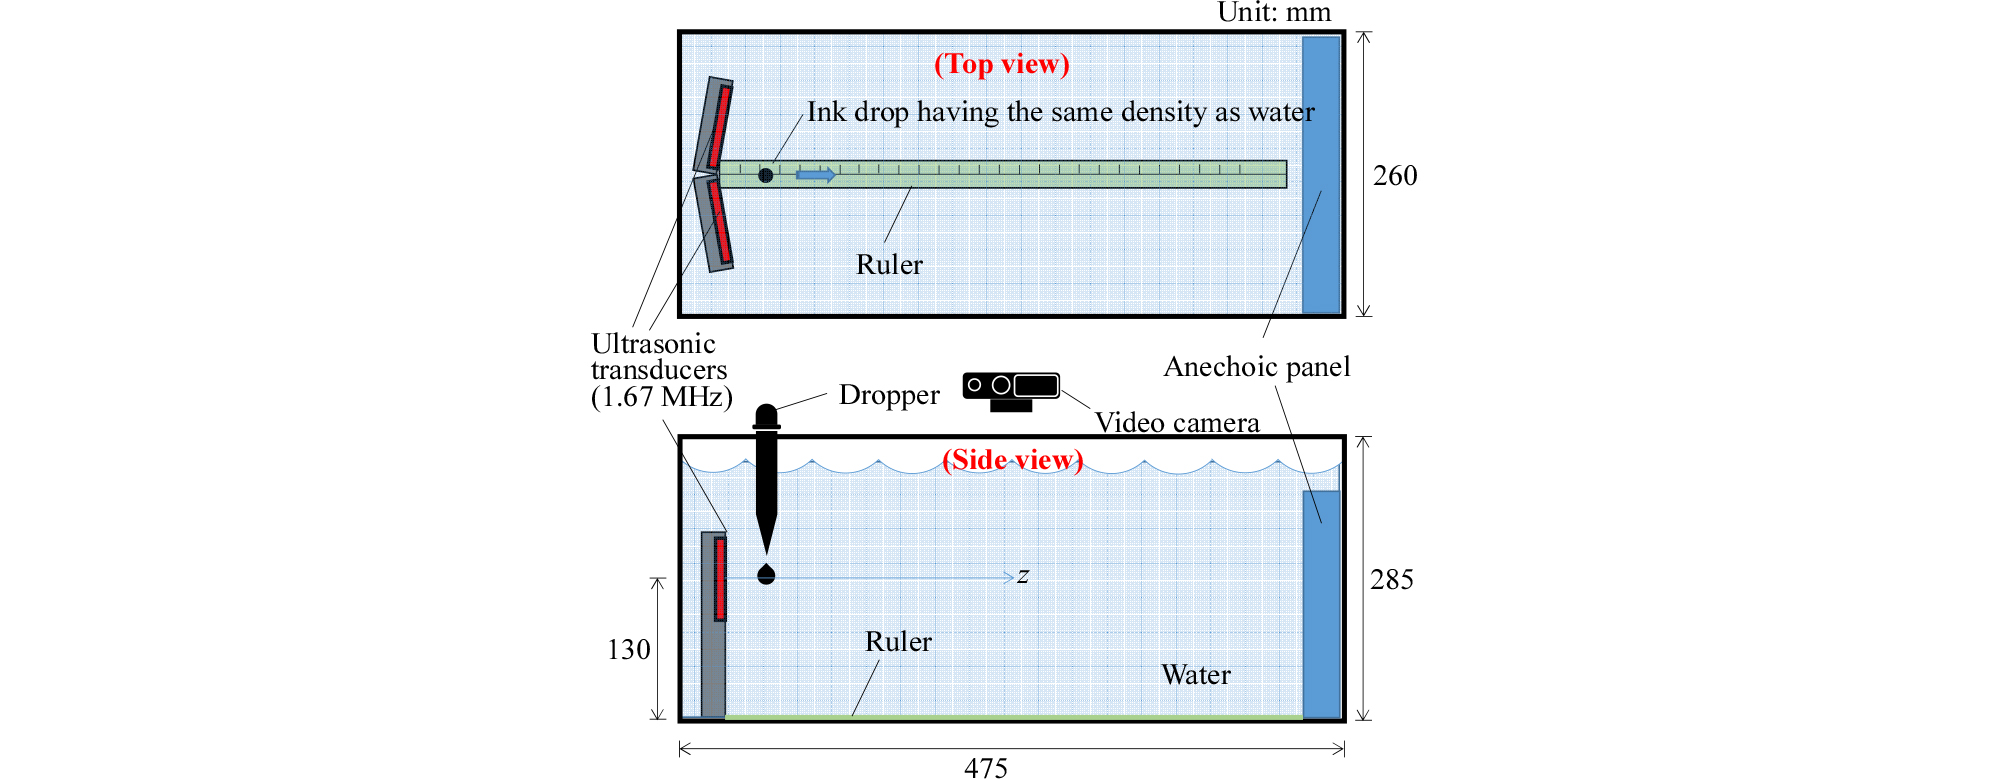
Two circular piston sound sources with a radius of mm of Fig. 1 (a) are arranged at an angle , as shown in Fig. 1 (b). The distance from the origin to the boundary of the circular sound source is d = 3.5 mm. This array is fixed at the left end of the tank, as shown in Fig. 2. A sound absorbing plate (Eastek, EUA201A) of 10 mm thickness is fixed to the right end and the sound absorption rate of this plate is known as -20 dB above 1 MHz.

In order to examine the characteristics of the piezoelectric vibrator used as a piston source, the input admittance of the transducer was measured and the results are shown in Fig. 3. In this figure, the resonant frequency appeared at about 1.7 MHz, and the value of conductance at resonance was about 50 mS.

To measure the total acoustic energy radiated from the ultrasonic transducer, the electro-acoustic conversion efficiency of the manufactured ultrasonic transducer was measured.
When the acoustic medium is water, the change in the input admittance locus, which varies with and without acoustic media, was measured, as shown in Fig. 4.
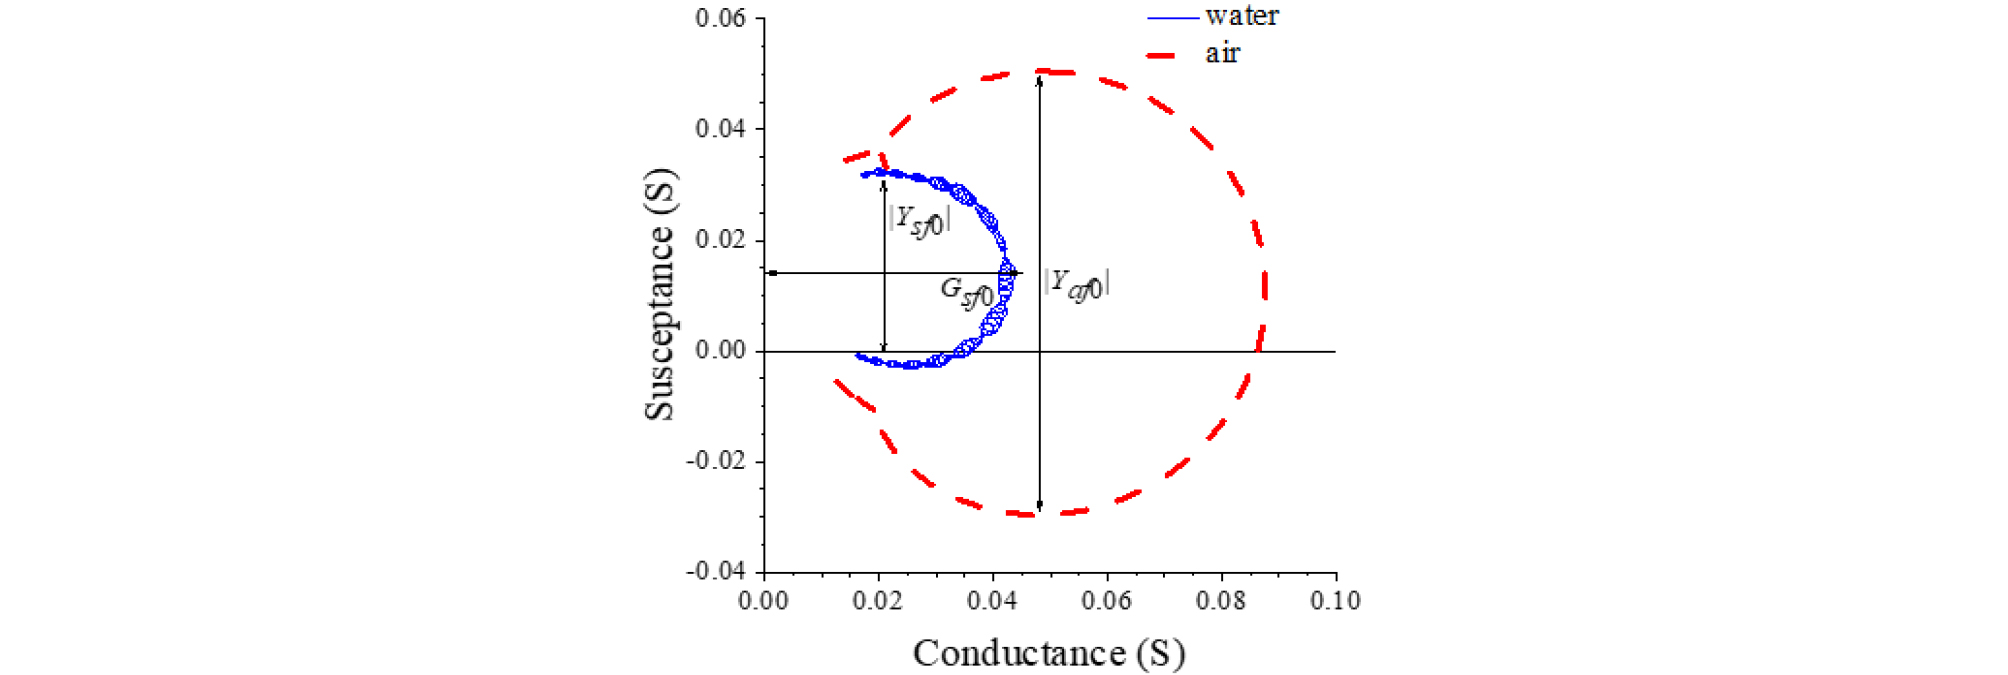
In this figure, and are the diameter of the admittance locus and the conductance at resonance with the acoustic load, respectively. is the diameter of the admittance locus without the acoustic load. The measured values of them are as follows.
mS, mS,
mS.
The electro-acoustic conversion efficiency of the ultrasonic transducer is given by the following equation.[19,20]
| $$\eta_{ea}=\frac{\left|Y_{sf0}\right|}{G_{sf0}}\left(1-\frac{\left|Y_{sf0}\right|}{\left|Y_{af0}\right|}\right).$$ | (6) |
Substituting the above values into Eq. (6), the electro- acoustic conversion efficiency was calculated as 45.4 %. The circular piezoelectric vibrators used as the piston sources were supplied with an electrical power of 30.48 Wrms. From the electro-acoustic conversion efficiency, the acoustic power radiated from the transducer array is therefore estimated as about 14.0 Wrms.
In order to measure the flow speed of the acoustic streaming on the z axis shown in Fig. 1, the droplet of the display liquid, which is an ink droplet diluted with ethanol to have the similar density to that of water in the tank, was released on the axis, as shown in Fig. 2. The ink droplet made a long ink tail along the flow of the acoustic streaming, and moved in a straight line along the axis. The length change of the straight line drawn by the ink was recorded by a video camera. Through the image processing, the length of the line made by the ink at each time was obtained as numerical data, and the instantaneous flow speed of the acoustic streaming was calculated by the numerical differentiation.
IV. Results and discussions
Fig. 5 shows the results of simulation by the finite element method (commercial COMSOL Multiphysics) when the angle between two piezoelectric vibrators is 150°. Fig. 5(a) and (b) show the acoustic field and the acoustic streaming speed distribution by the arrayed sound sources, respectively. The physical parameters used in the simulation are listed in Table 1.
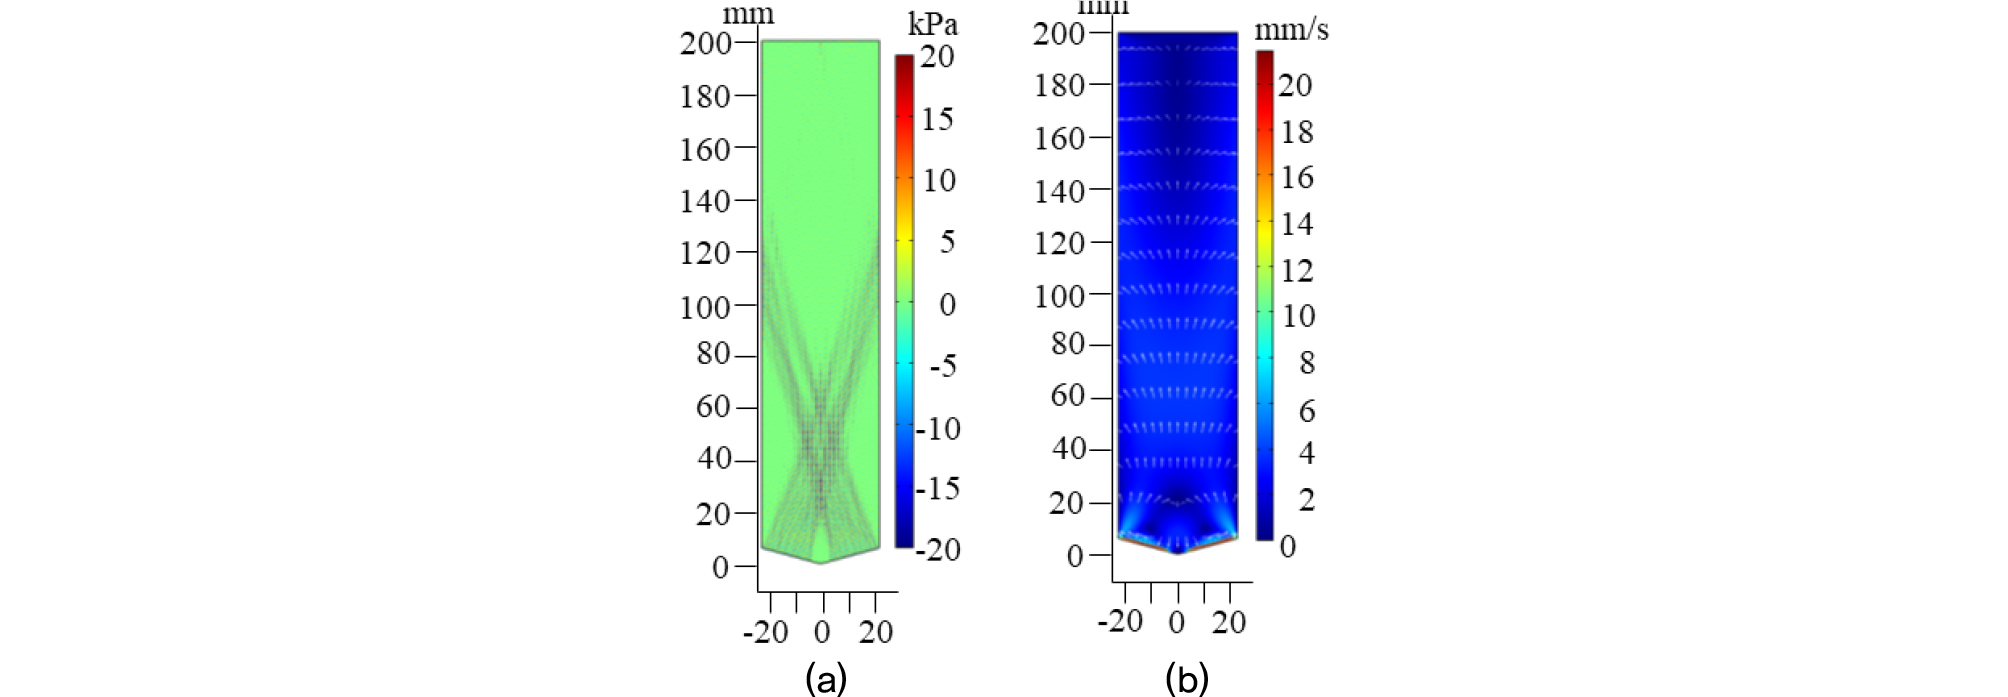
Table 1.
Physical parameters used in simulation.
At this time, proper boundary conditions were imposed on water so that it could be considered as an infinite medium both acoustically and hydrodynamically. Fig. 5(a) shows what the acoustic beams radiated from the two vibrators are crossed each other as the distribution of acoustic pressure, while Fig. 5(b) shows the flow speed distribution of the acoustic streaming caused by the acoustic pressure distribution of Fig. 5(a). The acoustic streaming is generated by the pressure distribution of a large amplitude, and it needs a region to form the acoustic streaming by the nonlinear acoustic effect. Therefore, the maximum region of the flow speed of the acoustic streaming generally appears after the maximum region of acoustic pressure.[21] From Fig. 5, we can see that the maximum flow speed of the acoustic streaming shows at the position of about 50 mm - 80 mm, whereas the maximum acoustic pressure appears at the position of about 30 mm - 50 mm from the sound sources.
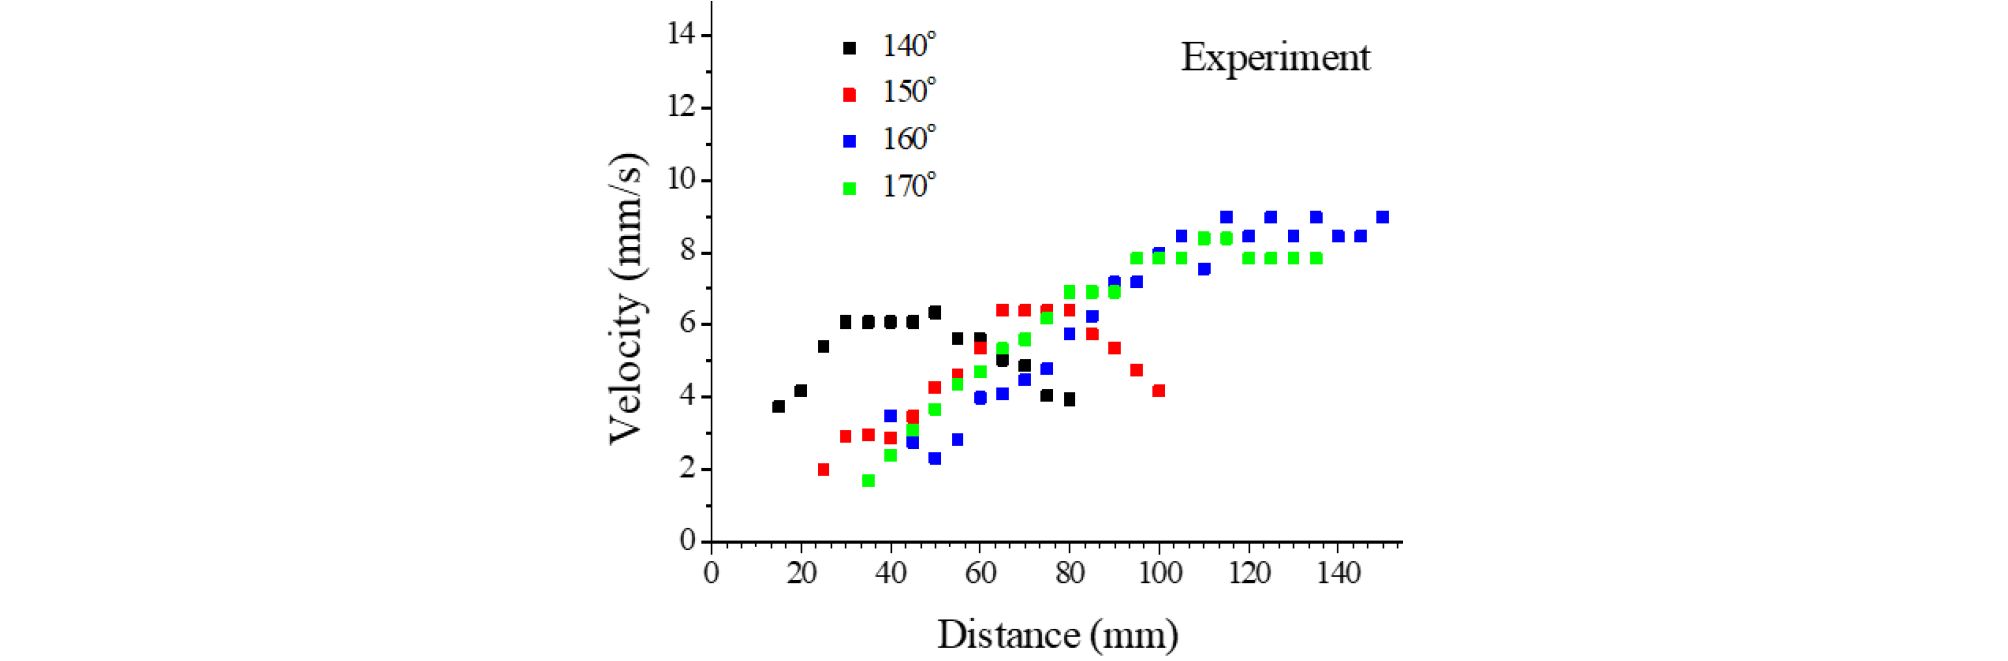
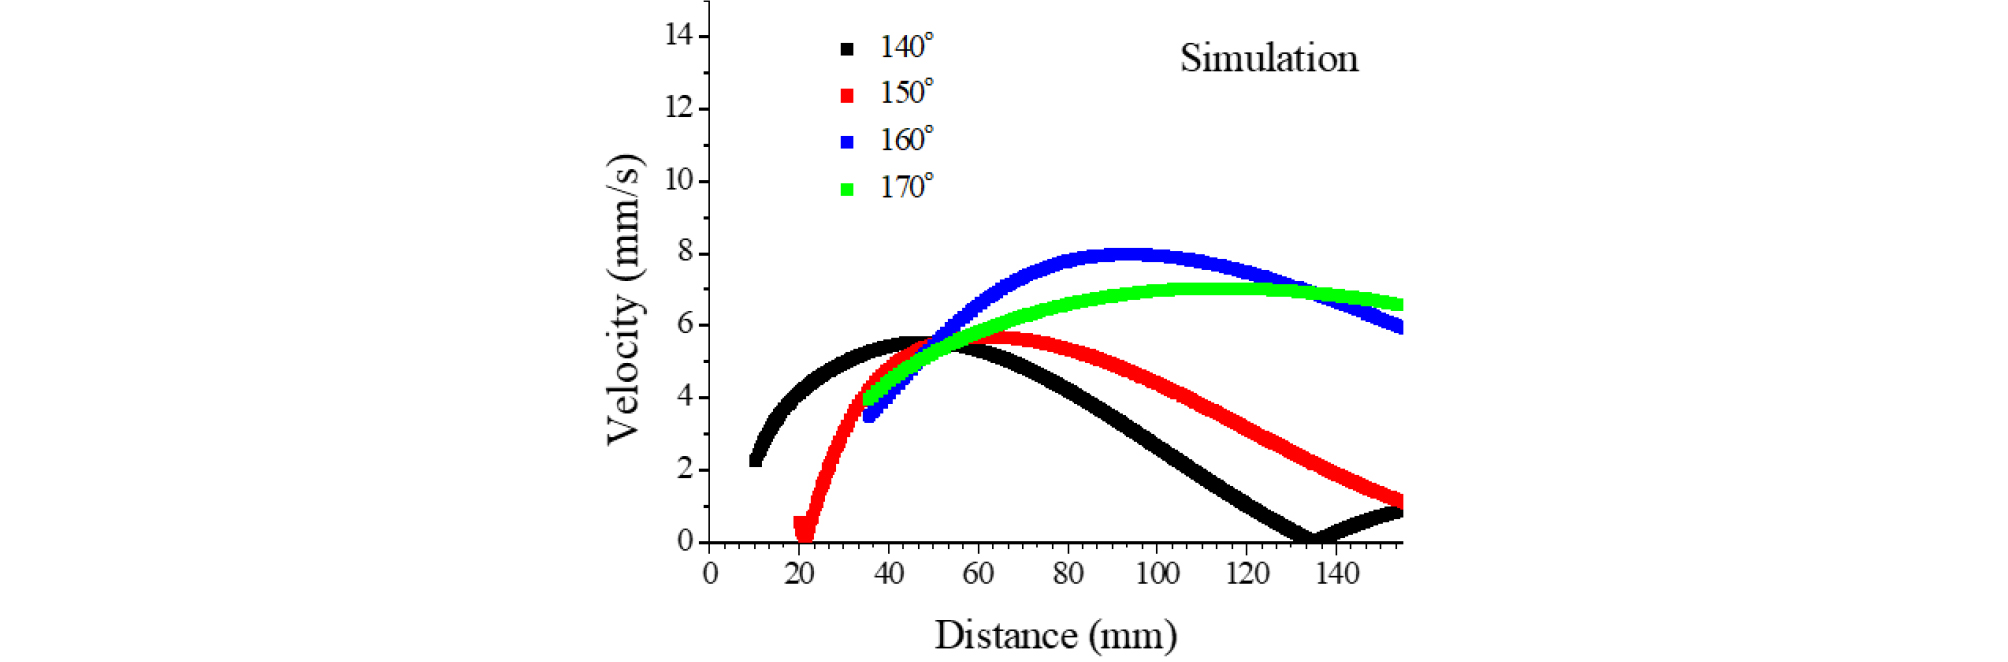
The flow speed distributions on the acoustic axis (z-axis in Fig. 1) were obtained for the different angles between the vibrators, as shown in Fig. 6. This result shows that the position of the maximum speed moves as the angle changes, and this tendency is similar to the result of simulation, as shown in Fig. 7. It can be seen from the results of Fig. 7 that the position of the maximum speed of flow is further away from the sound source as the angle between the two sound sources increases. In this result, as described in the result of Fig. 5, the geometric crossing region of the acoustic beam radiated from the two sound sources does not coincide with the maximum region of the flow speed.
Under the assumption of a near-field, the position of the geometrical intersection of two beams on the acoustic axis can be obtained by the following equation.
| $$Z=\frac{a+d}{\cos{\displaystyle\frac\theta2}}.$$ | (7) |
In the result of Fig. 7, when the angle between the two sound sources is 140°, 150°, and 160°, respectively, the positions of the intersections calculated using Eq. (7) were 39.47 mm, 52.15 mm, and 77.74 mm, respectively away from the transducer, whereas the maximum speed positions for the each angle were 48.11 mm, 62.02 mm and 93.13 mm, respectively. When the angle between the vibrators is 170°, the distance at which the two beams intersect cannot be calculated by applying Eq. (7) because the area is not in the near-field zone.
From the above results, it can be confirmed that the proposed simple method can be applied to measure the speed of acoustic streaming caused by two sound sources, and the tendency of the speed change with the angle between two sound sources is similar in the experiment and the simulation of Fig. 7.
V. Conclusions
In this study, as a basic step to analyze the acoustic streaming effect caused by multiple ultrasonic beams, the flow speed caused by the acoustic streaming with two identical piezoelectric vibrators was measured.
In order to measure the distribution of flow speed, a measurement method using a colored droplet, as an indicator, was proposed.
The change of the flow speed distribution was measured for various angles between the two ultrasonic sources. The measurement results showed a similar tendency to the simulation results based on the finite element method.
The results are expected to provide useful information in various of applications using multiple ultrasonic sound sources, such as, non-contact stirring systems, ultrasonic tweezers, and high purity nanoparticle dispersion devices.
