

I. Introduction
II. Measurement series
2.1 Launch measurements
2.2 Launch vehicle
2.3 Measurement locations
III. Analysis
IV. Conclusion
I. Introduction
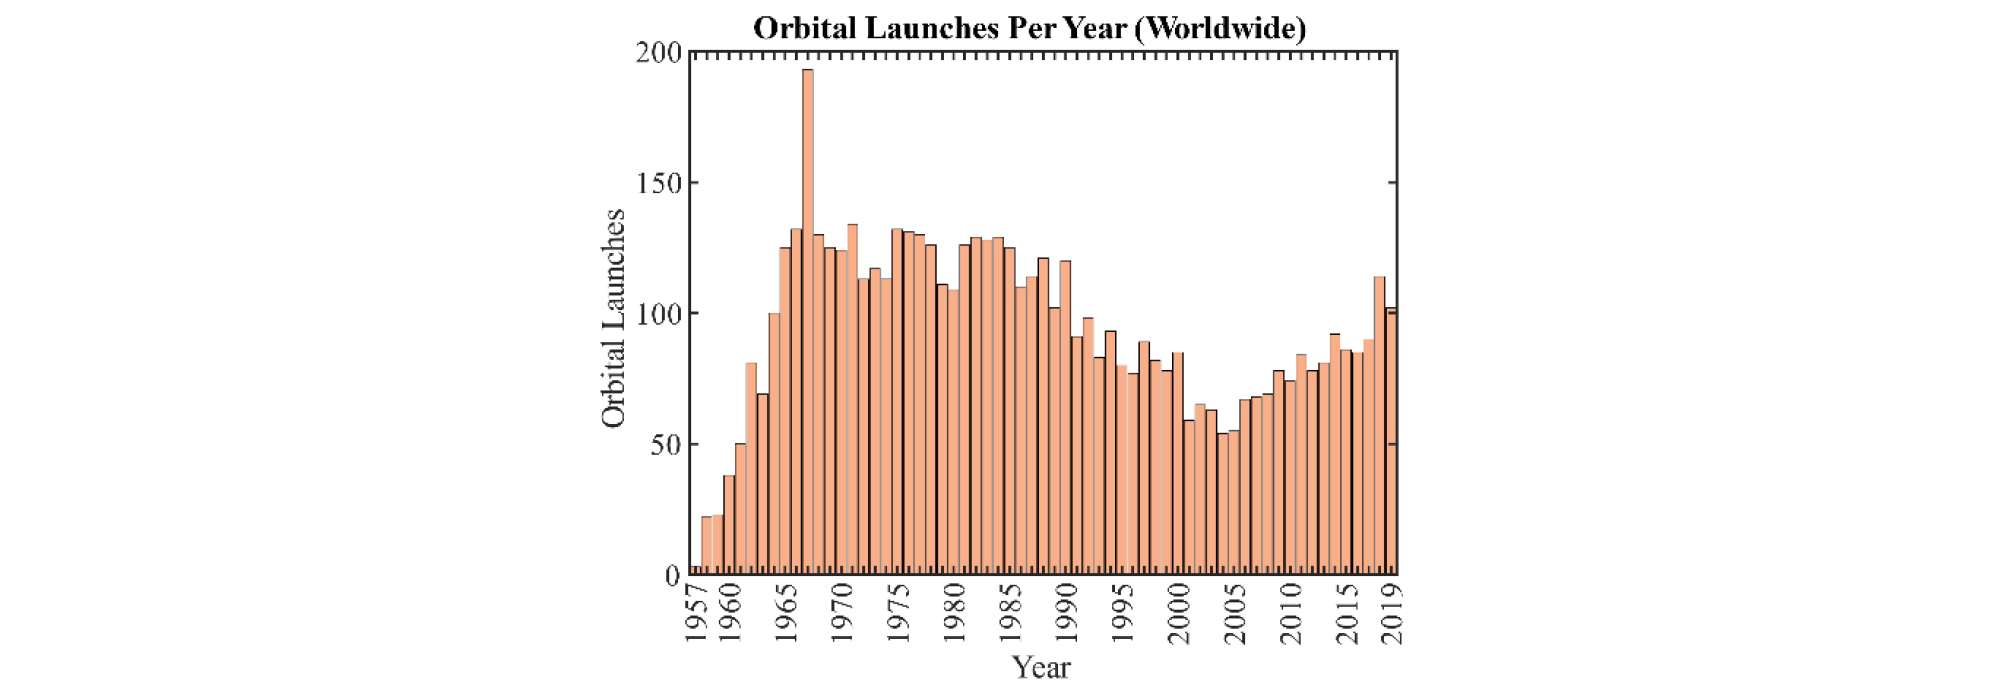
With orbital rocket launches on the rise (see Fig. 1) and proposed construction of more spaceports to accommodate the increased volume of launches, it is increasingly important to study the acoustics of these launches. Not only is assessment of vibroacoustic loading of launch pad structures, vehicles, and payloads important, but as these launches grow more frequent and launch sites move closer to population centers, far-field noise propagation and community impact is increasingly of interest.
Several launch vehicle studies have been performed by McInerny[1,2,3] and McInerny and Olcmen[4] These studies outline trends and time and frequency-domain characteristics of launch vehicle acoustics in both the near and far field.
Rockets fired horizontally in a static environment have also been studied by numerous authors. Among these studies, Mayes et al.[5] established directivities for static rocket sources, which served as a foundation for the directivity curve in NASA-SP 8072[6] peaking at around 50° for a “standard chemical rocket.” More recently, James et al.[7,8] have studied the directivity of the horizontally- fired Space Shuttle reusable solid rocket motor booster based on measurements by Kenny et al.[9] and found the peak directivity to be 60° ~ 65° across a broad range of frequencies.
When comparing launch vehicle directivities with those of static fired rockets, Cole et al.[10] discuss that static rocket peak radiation occurs at lesser angles relative to launch vehicles, between 70° and 80°. McInerny[1,2] note these discrepancies and concur with the finding that the steeper directivity angles relative to the rocket plume for launch vehicles.
Due to the infrasonic content of rocket noise, launches have been observed acoustically at distances up to and exceeding 1000 km[11,12] and infrasound from launch vehicles has been used to characterize the number and firing duration of rocket stages in the vehicle launch.[13] From high-fidelity recordings, we can acoustically identify the events during the launch such as ignition, cutoff of engines, stage ignition, etc.
While singular studies of space vehicle launches can provide meaningful insight into the acoustical characteristics of a launch, study of multiple similar launches measured from a single location allows for a comparative analysis. The focus of this paper is an initial examination of measurements made at three different space vehicle launches from the same site.
II. Measurement series
2.1 Launch measurements
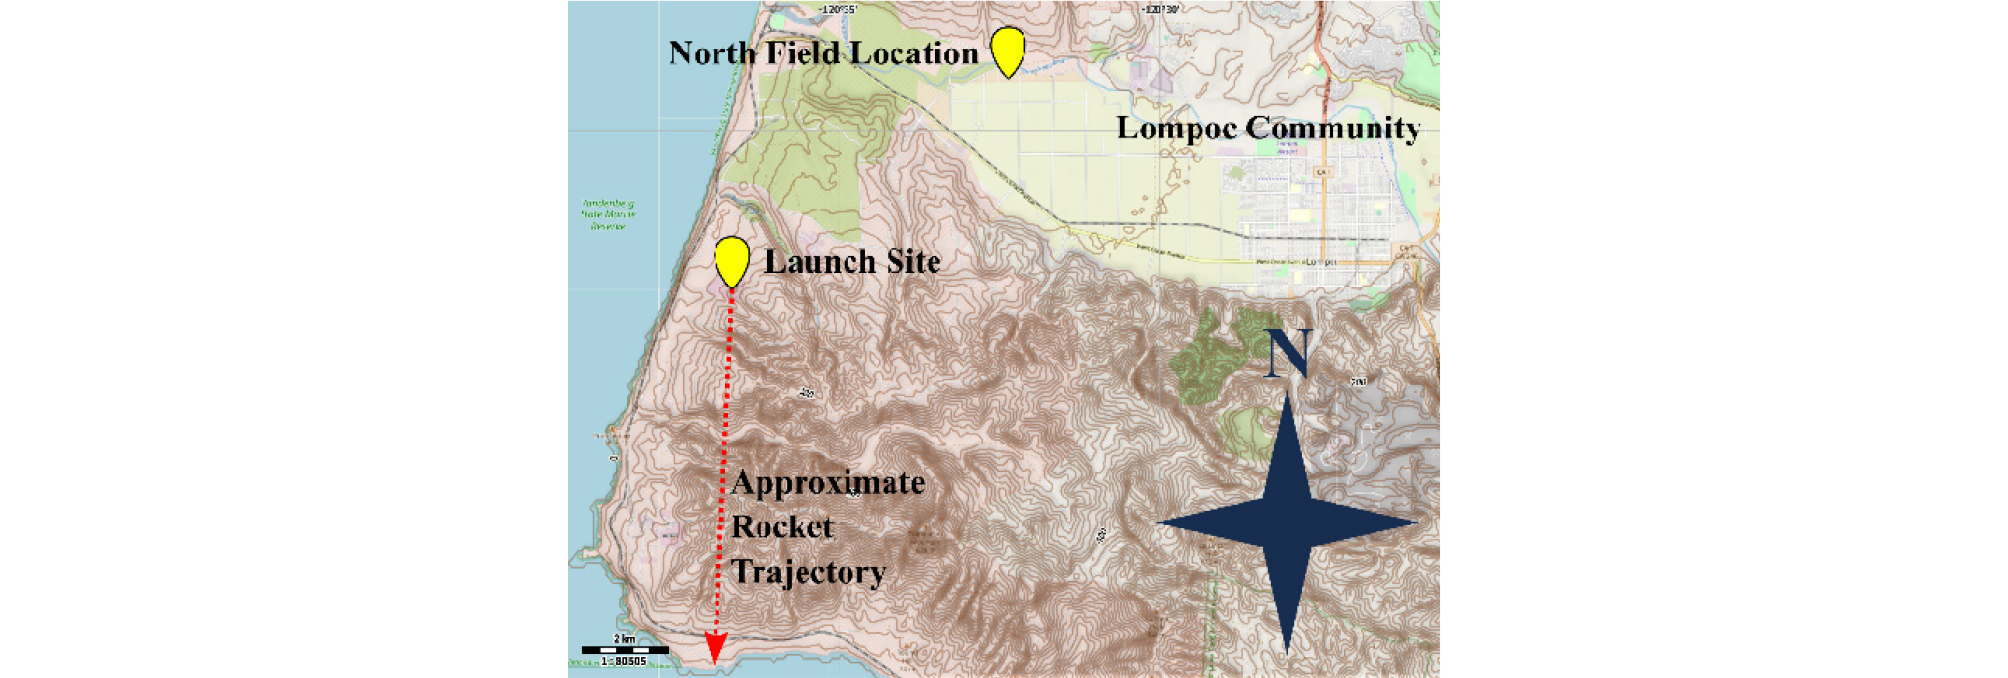
Three different launches of Falcon 9 vehicles were studied. All three launches originated from the same launch facility, SLC-4E at Vandenberg AFB, California, USA as shown in Fig. 2. Each of these launches utilized the same version of launch vehicle, the Falcon 9 ‘Block 5’ variant, ferrying satellites into similar orbits. The launches observed with corresponding destination orbits were as follows:
- IRIDIUM 7 NEXT (25 July 2018): 625 km × 625 km, 86.4° Polar.
- SAOCOM 1A (07 October 2018): 615 km × 634 km, 97.90° Sun Synchronous (see Fig. 3).
- RADARSAT Constellation (12 June 2019): 593 km × 593 km × 97.74° Sun Synchronous.
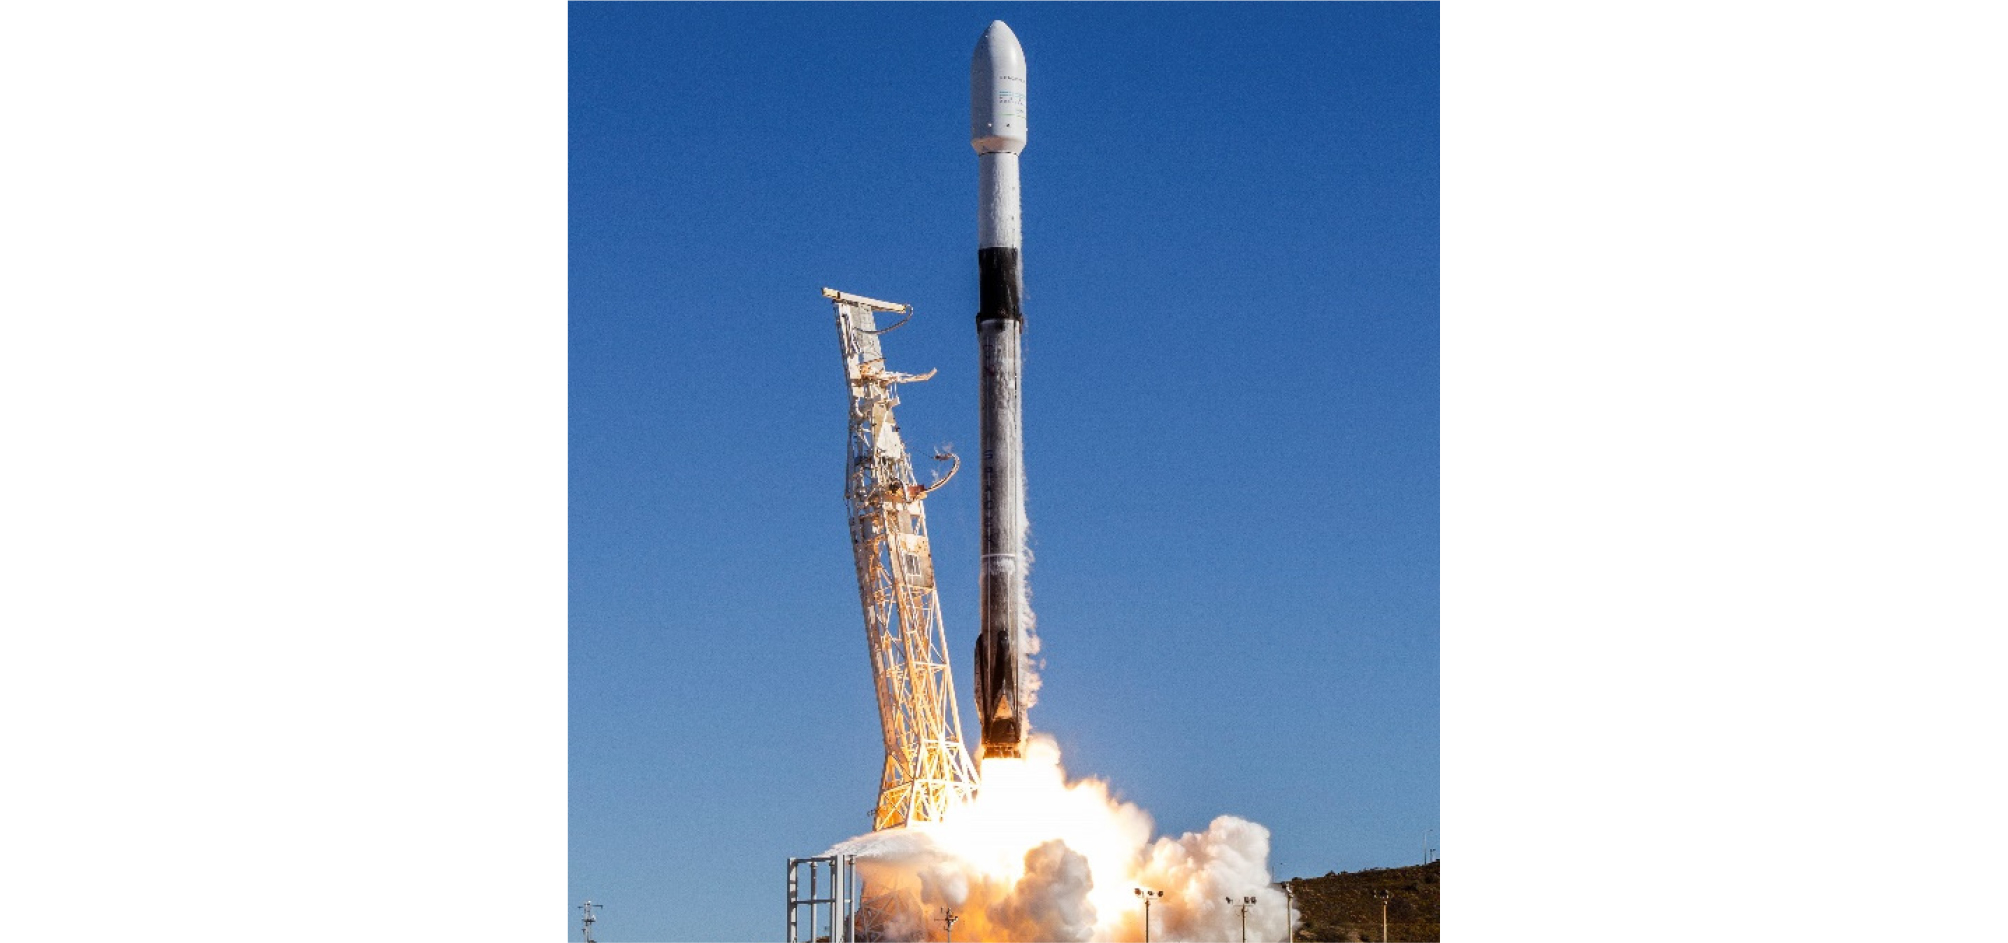

2.2 Launch vehicle
The launch vehicle being studied is the Space Exploration Technologies Corp. (SpaceX) Falcon 9 Block 5 variant (depicted in Fig. 2), so named for its nine first-stage rocket engines. These nine liquid-fueled engines produce a nominal thrust at sea level of 7,607 kN.[14] This first stage burns for about 160 seconds total, at which point main- engine cutoff (MECO) occurs and the first stage separates from the second stage and either falls in to the ocean or returns for landing. The second stage, consisting of a single vacuum-optimized engine, ignites around 10 s ~ 15 s after stage separation and completes the insertion of the payload into the desired orbit. The Falcon 9 is 70 m tall with fairing and has a nominal stage diameter of 3.7 m.
The liquid-fuel engines utilize a hypergolic fuel mixture to start the ignition process and provide reignition for booster re-entry and propulsive landing. This process produces an Ignition OverPressure (IOP) that is acoustically visible as a waveform impulse. The IOP serves as a consistent reference point for engine ignition between launches and across measurement stations.
2.3 Measurement locations
Measurement sites were selected in the far field around the community of Lompoc, California, adjacent to Vandenberg Air Force Base and to the northeast of the launch pad. Lompoc sits in a valley slightly off the coast with large open spaces of farmland bordering the base. Most measurement locations in this test series were located at various points in these fields.
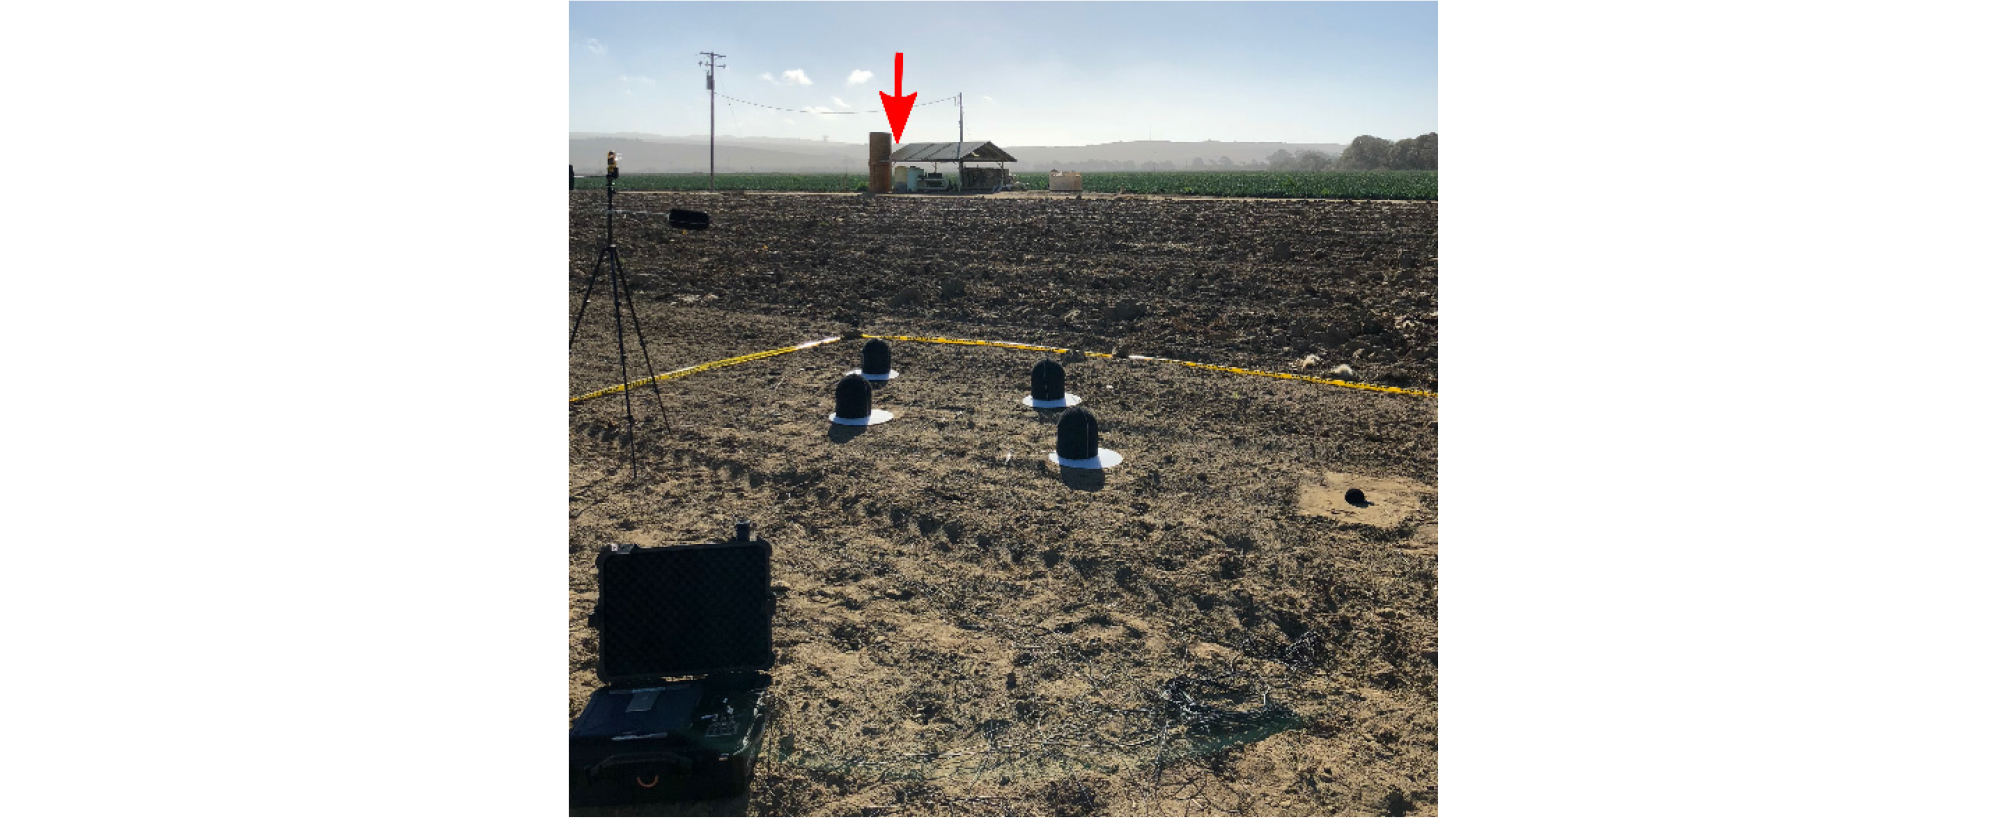
Although the quantity and location of measurement sites differed between measurements, one location in the northern central part of the fields was kept as consistent as possible (~8300 m radially from the launch site) between launches allowing for comparative analysis at this location. This “North Field” measurement location is shown in Figs. 4 and 5, and is used for comparative analysis between all three launches.
III. Analysis
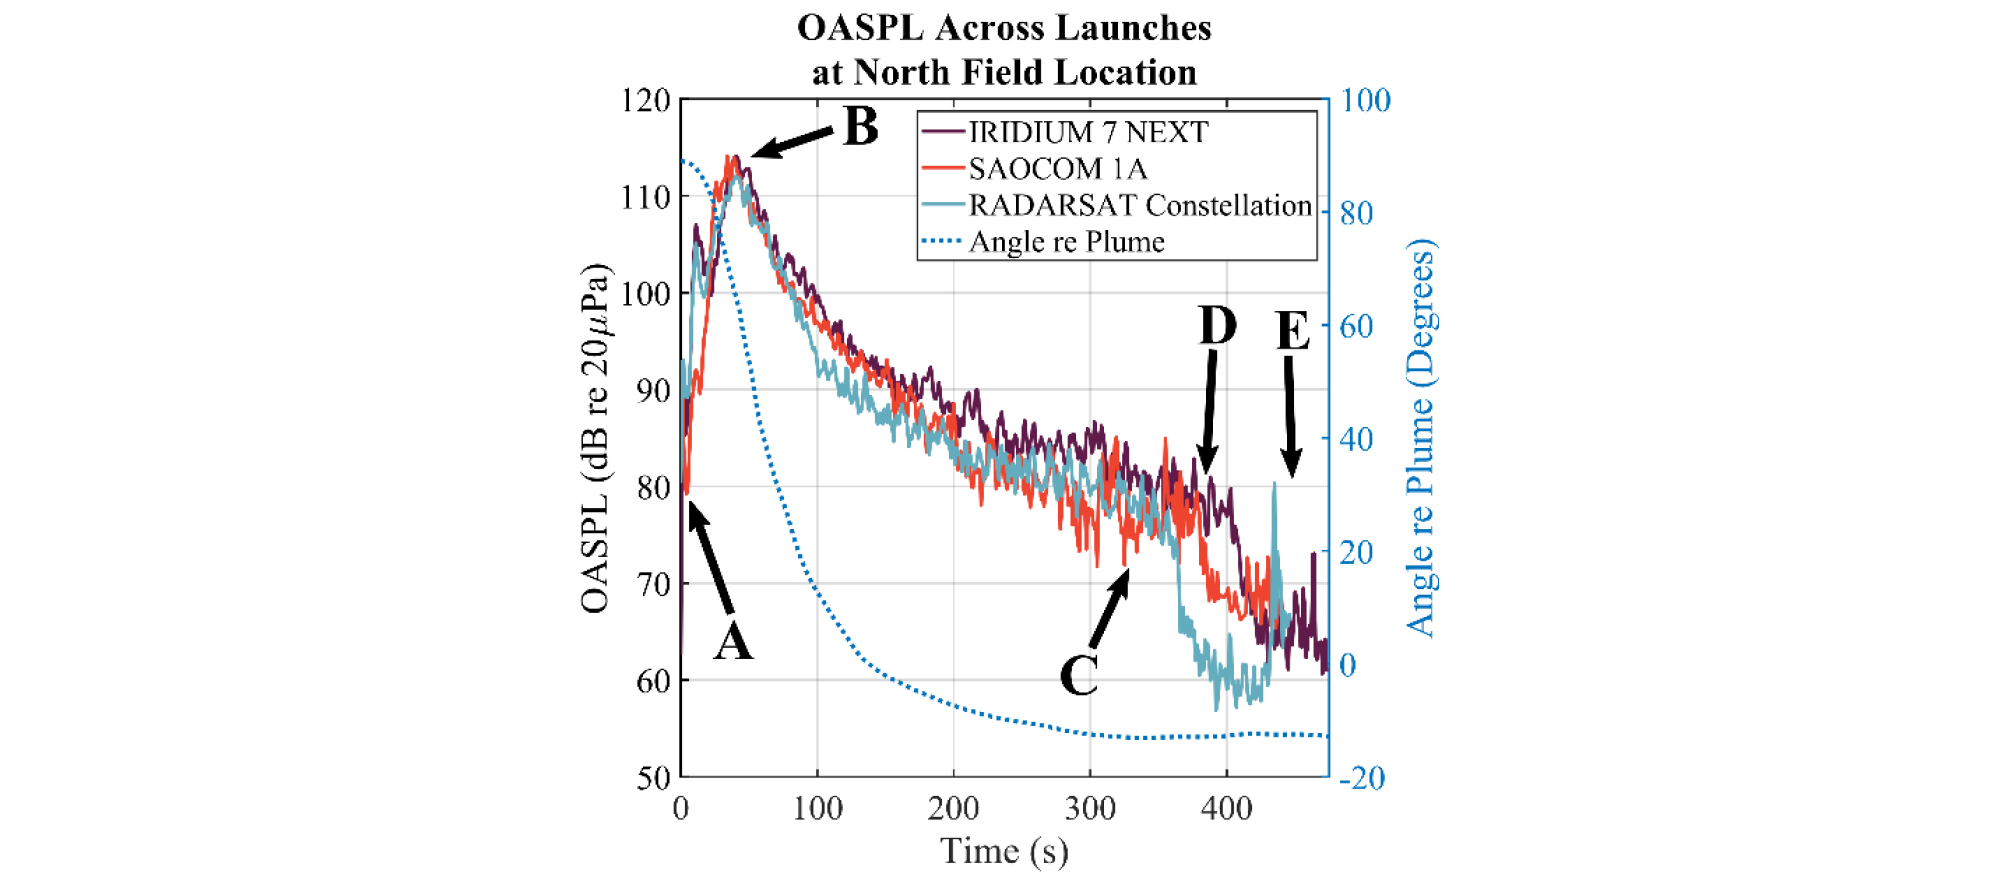
Fig. 6 shows the running Overall Sound Pressure Level (OASPL) of the three observed launches at the North Field location, beginning at the ignition overpressure. Key analysis points during the launch sequence are labeled with letters A-E for reference. Overlain on this plot is the approximate angle relative to the rocket plume from the measurement site, as demonstrated in Fig. 7.

Time scales in all figures reflect observer time. To simplify discussion, all time referenced in this discussion will be noted in retarded (observer) time, To. It should be noted that the vehicle trajectory is such that it passes through multiple atmospheric layers with different air temperatures, densities, and winds which all contribute to changes in sound speed throughout the flight, as well as curved ray propagation. However, the limited scope of this study only considers straight-ray propagation with a constant average sound speed of 340 m/s. In particular, this model is used when discussing early and late-launch phenomena when the rocket is below 5 km and around 80 km in altitude, respectively.
It is worthwhile to address the assumption of a constant sound speed. During the early launch period, the vehicle is within 10 km of the measurement site, and a variation in average sound speed of 340 m/s ±20 m/s would result in a propagation time variation of about ±2 s, which is well within the acceptable uncertainty for the purposes of this study.
The late-launch period phenomena discussed occur at vehicle altitudes of 60 km ~ 70 km (within the mesosphere.) When observing sound speed through the atmosphere as shown by Rind and Donn[15] it can be seen that at these altitudes, the sound speed averages out to roughly 340 m/s, which is sufficient for calculating event time of arrival. Additionally, the vehicle trajectory is roughly North/South, reducing some of the variability introduced by East/West winds common in the stratosphere.
Fig. 8 shows 2 s samples of waveforms during portions of the RADARSAT Constellation launch referenced in Fig. 6. It should be noted that amplitude scales vary between waveforms. The waveforms displayed have been high-pass filtered at 0.5 Hz due to very low-frequency non-acoustic pressure offsets in the waveform likely due primarily to wind noise.
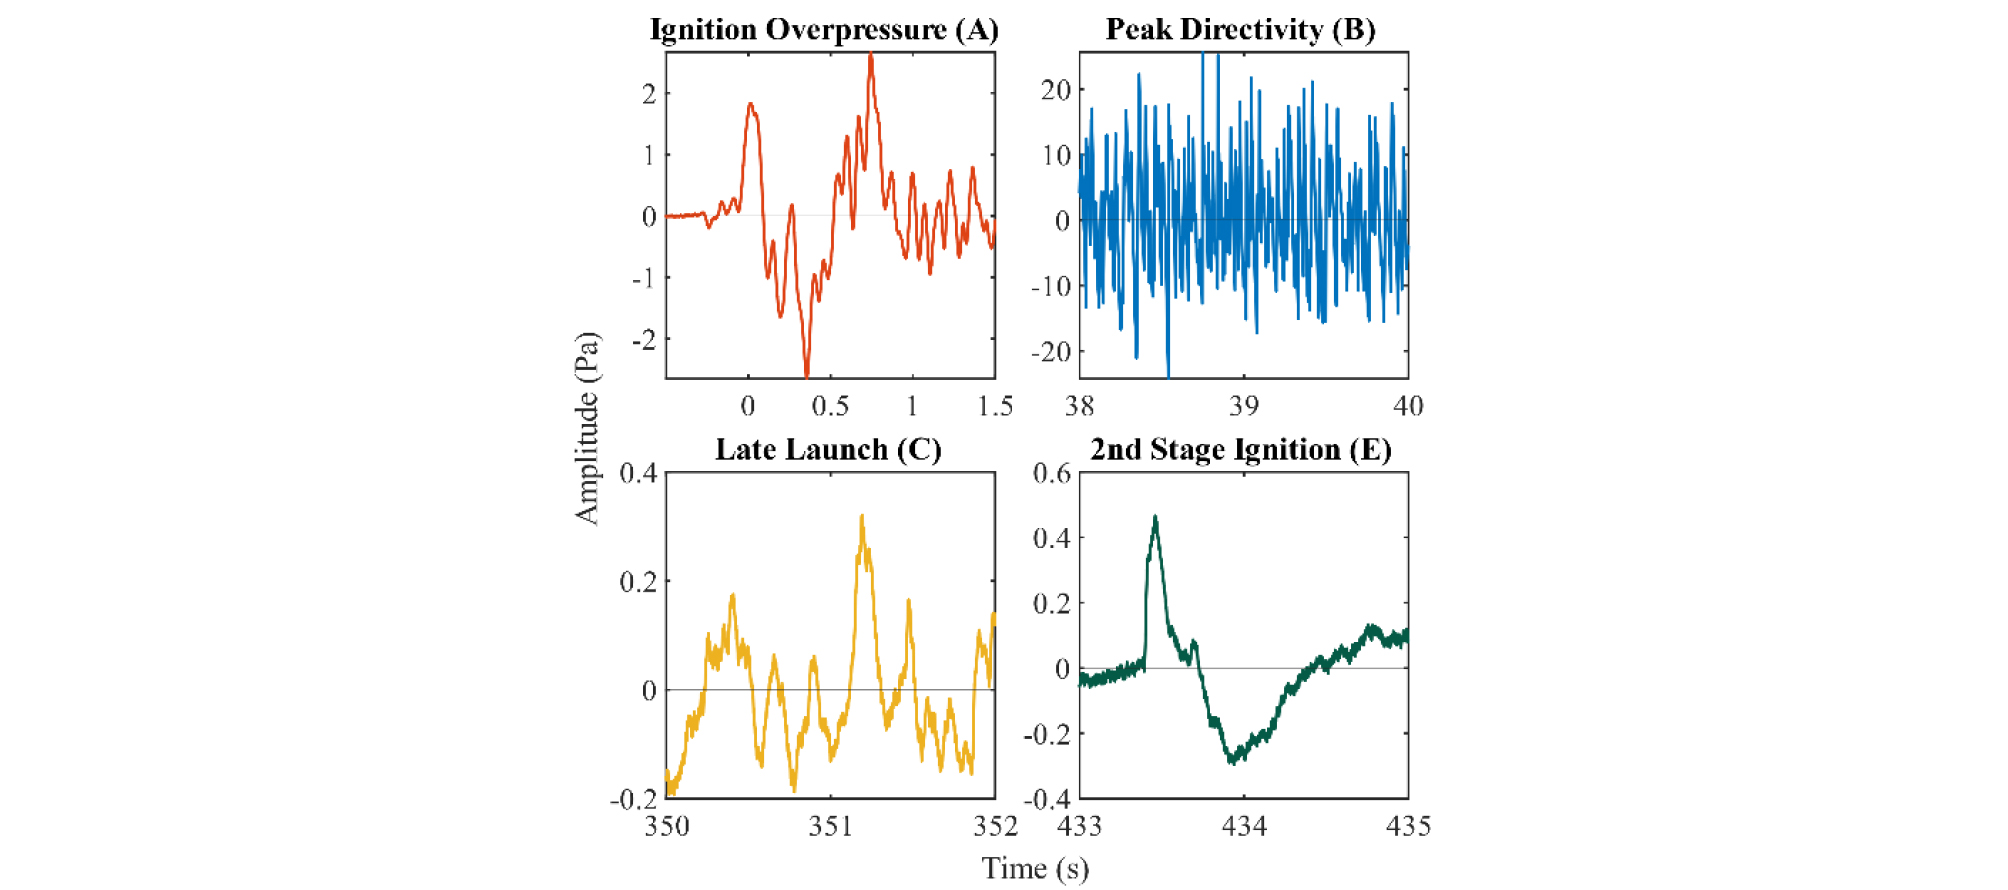
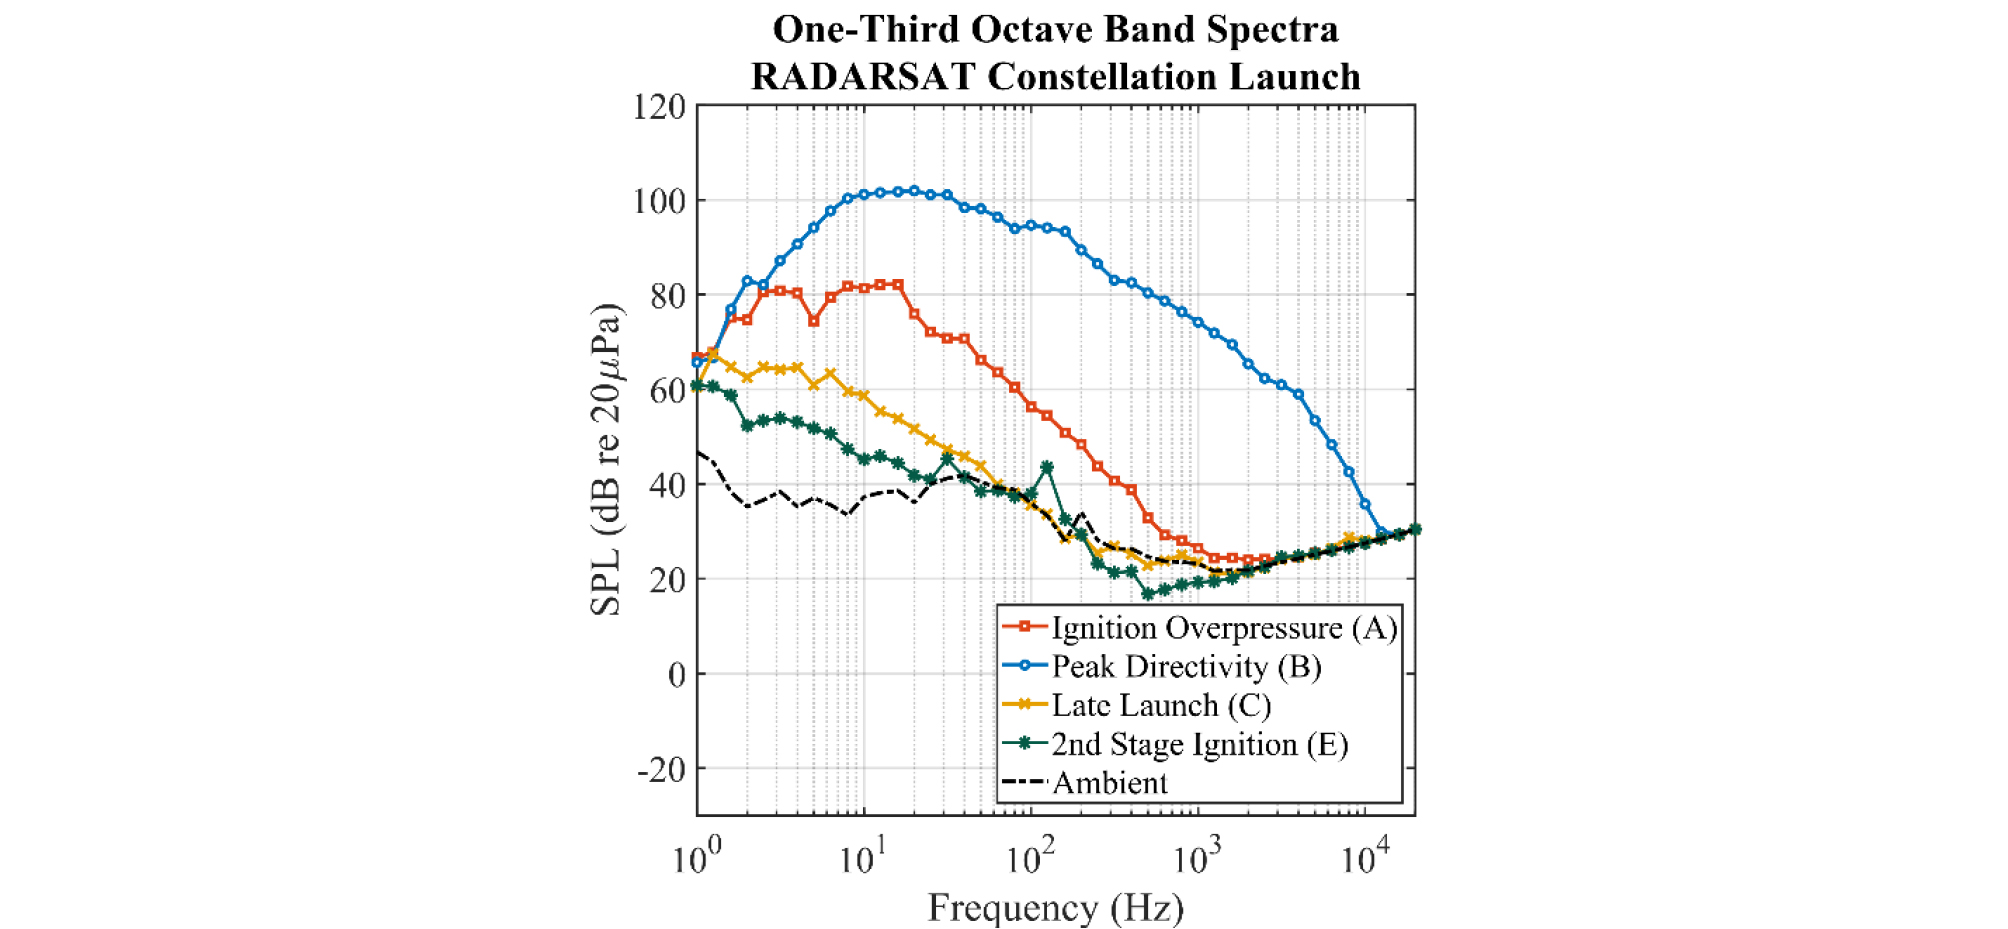
Fig. 9 shows one-third octave spectra for different portions of the launch sequence corresponding with the events in Fig. 8. Additionally, an ambient spectrum from immediately before the launch is included.
Early launch period
The launch begins with the ignition overpressure. As shown in Fig. 8 waveform A, the ignition overpressure produces an impulse-like shape in the waveform with an approximate period of 0.8 s (~1.25 Hz) with some higher frequency content present. When observing the frequency content of the IOP in Fig. 9 Spectrum A, the expected low frequency content is present, with peaks around 3 and 16 Hz. Although the IOP event is primarily infrasonic, the signal is above 50 dB through 100 Hz, showing some energy in the audible range.
The IRIDIUM 7 and RADARSAT launches show a great deal of similarity during the initial 20 s of the launch (from points A to B), where OASPL rapidly increases to ~106 dB at approximately 10 s ~ 11 s, and then briefly subsides to ~100 dB before increasing to maximum OASPL (B). This trend is not observable in data from the SAOCOM 1A launch, however. Instead, a more steady increase in OASPL is apparent from ignition to maximum OASPL (A to B) for SAOCOM 1A at North Field.
Although we cannot conclusively identify the cause of this difference between IRIDIUM 7/RADARSAT launches and the SAOCOM 1A launch, some possible explanations can be proposed. The thrust profile and trajectory of the SAOCOM 1A flight may have differed significantly from the other two flights, however, when reviewing telemetry data it appears vehicle trajectories are very similar. This is true especially in the early period of the launch when the vehicle is traveling primarily vertically. Since thrust profile and high precision trajectory data cannot be readily obtained, this postulate cannot be verified. However, a ~10 dB relative increase during this launch period and then a ~6 dB decrease suggests a ten-fold increase and four-fold decrease in thrust relative to the SAOCOM 1A launch. Although the thrust profile varies during the launch sequence, it would not be reasonable to expect variations in thrust to be on this order, especially between launches.
Another plausible explanation for this variation could be that the meteorological conditions affected the OASPL of the launches. Both the IRIDIUM 7 and RADARSAT launches occurred with a dense marine layer fog that extended 100 m ~ 200 m above the ground. Upon reviewing launch footage, it is observed that the rocket plume clears the fog layer at approximately To+11 s into the launch. This corresponds with the timing of the initial peak and then brief subsiding of OASPL. Thus it is reasonable to conclude that fog may have contributed, at least in part, to the initial differences in levels between launches.
Despite possible differences between launches (weather, trajectories, etc.), the time of measured peak radiation values (B) are remarkably consistent across all three launches. IRIDIUM 7 and SAOCOM 1A launches reached a maximum OASPL of 114 dB, while RADARSAT reached a maximum of 112 dB. All three maxima occurred near To+40 s into the launch.
Regarding this peak radiation, if the launch trajectory is known, an approximate directivity can be proposed. Since directivity is relative to the vehicle, we can expect that the signal will decay more as the rocket moves farther away from the launch site. However, the peak radiation in this study was measured early into the launch. The distance from the vehicle to the measurement site only varies by about 25 % during the period of interest, translating to a total decay of 2 dB which is negligible for the purposes of this paper. Therefore, we can expect that the measured peak radiation and the actual peak directivity of the vehicle will be similar.
Regarding directivity analyses, Cole et al.[10] found that peak directivity angle of static rocket fired horizontally to be between 50 deg and 60 deg, while launch vehicle directivities tended to shift upstream to 70 deg to 80 deg. McInerny[2] also found peak directivity angles of 70 deg to 80 deg from launch vehicle data. James et al.[7,8] modeled the directivity of a rocket plume to have maximum radiation at approximately 65 deg with the 6-dB down OASPL region falling within approximately 45 deg to 85 deg. These studies have thus shown a discrepancy between static and launch directivity curves.
When examining the launches in this study, using approximate telemetry data with retarded time, it is seen from Fig. 6 that peak measured radiation occurs at an angle of approximately 65 deg, with the 6-dB down OASPL region falling within approximately 45 deg ~ 80 deg. This more closely agrees with the predictive model used by James et al. and falls between the static and launched rocket directivities found by Cole et al.[10]
Spectra throughout launch phases are shown in Fig. 9. Spectrum B shows the one-third octave band levels around the time of peak directivity of the RADARSAT Constellation launch. The measurement bandwidth at this time is approximately 10 kHz, based on a comparison with the ambient noise, and significant high-frequency content is present. The peak frequency is about 20 Hz and Sound Pressure Level (SPL) is above the instrumentation noise floor through 10 kHz. The presence of high-frequency content at these propagation distances, where atmospheric absorption is large, is a result of nonlinear propagation.[16,17] Waveforms from the peak directivity period also show the prevalence of higher frequency content of high amplitude, as shown in Fig. 8 waveform B.
Mid-launch period
During the middle portion of the launch, To+100-300 s, levels follow similar trends during the mid-launch period as opposed to the groupings seen in the early launch period with the IRIDIUM 7 and RADARSAT launches. Variations in levels between launches are around 6 dB to 8 dB maximum, as seen in Fig. 6. Considering the distance of propagation during this time is 10 km to 60 km, this level of variability is relatively minor.
Late-launch period
Late into the launch, much of the observable frequency content is within the infrasound (< 20 Hz) regime. This can be seen in the waveform in Fig. 8 waveform C and in the spectrum in Fig. 9 spectrum C.
When examining measurement bandwidth in the late launch period, it can be shown that the effective measurement bandwidth at event C at To+350 s is approximately 50 Hz. This is significantly larger than bandwidths in previous infrasonic rocket studies; Donn et al.[11] obtained a bandwidth of ~1 Hz, while Kashak et al.[12] obtained a bandwidth of ~2 Hz. It should also be noted that many of the launches recorded in these studies were measured at distances greater than those in this paper, so an improvement in bandwidth would be expected here. However, the bandwidth obtained in this study is still an important result and may be attributable to modern high-fidelity measurement equipment and a relatively quiet ambient measurement environment.
Late into the launch, at between To+360-400 s indicated by event D, levels drop about 15 dB for a period of time. In the IRIDIUM 7 and RADARSAT launches, a short pulse of low frequency (event E) is seen between 70 s ~ 90 s after the drop in SPL. This was observed at all measurement locations at both tests.
This late-launch drop in energy followed by a subsequent low-frequency impulse could correlate with the Main Engine CutOff (MECO) and Second-stage Engine Start (SES) of the vehicle. Using the approximate distance from the rocket to the measurement site and known MECO and SES times, the estimated retarded time of the events was computed (again assuming an average propagation speed of 340 m/s). These approximated times and the possible corresponding phenomena observed in measured data are presented in Table 1.
Table 1.
Measured Late-launch phenomena with corresponding times of occurrence and computed time-retarded vehicle events.
| Launch | SPL Drop (Meas.) | MECO (Comp.) | Impulse (Meas.) | SES (Comp.) |
| IRIDIUM 7 NEXT | 409 s | 408 s | 464 s | 479 s |
| SAOCOM 1A | 381 s | 383 s | - | 460 s |
| RADARSAT Constellation | 365 s | 354 s | 435 s | 421 s |
Although sound speed varies through the atmosphere, by using a straight-ray model for propagation it can be shown that the drop in SPL and the subsequent impulse may be related to the MECO and SES. The predictions made by this model vary up to 14 s from observed phenomena. These events occur when the vehicle is around 80 km ~ 100 km from the measurement location and considering a variation in average sound speed of 340 m/s ± 20 m/s, this would produce a variation in time of ~±18 s, which places the predictions well within this uncertainty.
As noted, the period from events D to E, was measured to be 70 s ~ 90 s in duration. The space of time between MECO and SES is nominally 11 s, with the vehicle velocity between 1600 m/s and 1900 m/s, depending on the launch. This would translate to 50 s ~ 60 s in additional propagation time for the SES. Combine this with the actual time between events and the SES would be expected at about 60 s ~ 70 s after the drop in SPL, similar to what is seen in Fig. 6.
IV. Conclusion
Despite the three measured launches occurring at different times of year with different weather conditions and different payloads and trajectories, a high deg of similarity is exhibited between all three rocket launches.
Similarities and differences are seen in the early stages of the launch, with the IRIDIUM 7 NEXT and RADARSAT Constellation launches having highly similar trends in OASPL during the first 20 s. This may be related to the presence of a heavy marine layer fog near the ground during the launch.
Minutes into the launch near the end of the first stage burn, an effective measurement bandwidth of ~50 Hz is maintained, demonstrating excellent propagation of infrasound from the vehicle over large distances.
Finally, events such as the main engine cutoff and second-stage engine start are correlated with observed phenomena in acoustic levels measured at multiple locations over multiple launches.
